
The Economics of Natural Disasters

"What has so often excited wonder [is] the great rapidity with which countries recover from a state of devastation; the disappearance, in a short time, of all traces of the mischiefs done by earthquakes, floods, hurricanes, and the ravages of war."
—John Stuart Mill
May—the month of graduations, the unofficial start of summer vacation, and tornadoes. You don't live in an area threatened by twisters? Then perhaps to you May means the beginning of wildfire season. Or maybe you are more concerned about hurricane season, which begins on June 1. Regardless of where you live, there is barely a spot on this planet that isn't affected by wind, rain, fire, drought, flood, or earthquakes.
When natural disasters hit, the victims may feel as if there is no chance of recovery. In fact, those far away may feel the same way. In 2017 the United States experienced hurricanes Harvey, Maria, and Irma, which wreaked destruction from Texas to South Carolina. The Thomas fire in California destroyed more than 1,063 structures and burned an area greater than 440 square miles.1 Nearly 1,400 tornadoes ripped through central and southern states, with nearly 300 in May alone.2 Flooding forced 188,000 residents to evacuate their homes near the Oroville Dam in California, and later in 2017, heavy rain caused severe flooding in Missouri, Arkansas, and Illinois. Observing the destruction of homes, businesses, infrastructure, and the environment, one might wonder if it is possible to get back to normal. In rare cases, the return to pre-disaster normal is impossible. It is far more likely, however, that the recovery will ultimately make conditions as good or better than they were before the disaster.
The costs of disaster can be difficult to assess for a number of reasons. For example, a damaged business might relocate, permanently close, or rebuild. The loss to the community is permanent in the case of relocation or closure, but only temporary if the business rebuilds.3 Let's take a look at various types of costs.
Costs Associated with Direct Losses
Direct losses are a result of the immediate damage from a disaster. Such losses can be broken into two types: market losses and non-market losses.4 Direct market losses are losses to assets that have a market value, such as a house or a car. The dollar value of these losses is relatively easy to determine. Direct non-market losses are losses of assets for which a price isn't easily determined because the asset isn't bought or sold in the marketplace. An example of a non-market loss is a historic building that collapses in an earthquake. It is possible to calculate the cost of rebuilding, but how do you calculate the value of the historical significance of the building?
Costs Associated with Indirect Losses
Indirect losses follow a disaster and are secondary to direct losses. Say a business is destroyed in a fire. Direct losses are the building and equipment. Indirect losses are the wages that the workers will not earn because the business is not operational and the output that will not be available to consumers. Then there are infrastructure losses where positive externalities are lost,5 such as a missing section of highway that increases workers' commute time by an hour.
Opportunity Costs
Replacing capital reduces the amount available for new capital elsewhere. Resources devoted to reconstructing homes damaged in a disaster are not available for new construction. Construction and utility workers are lured to disaster areas by higher wages. The good news about "demand surge" wage increases is that reconstruction in the afflicted areas gets underway quickly.6 The bad news is that these workers are not available elsewhere.
Who Shares in the Costs?
Imagine living in a coastal town in the path of a hurricane. You and every neighbor would board up the windows and secure anything that could blow away. Despite the precautions, when the hurricane hits with winds up to 160 mph, your neighbor's small frame home collapses. Your roof is ripped away, along with those of most houses and businesses. The roof debris along with tree branches and power poles smash into buildings. The storm moves inland, and the winds die down. Now, there is just rain—for days. The waterways back up, and soon buildings miles away from the coastline sit in three feet of water. The disaster is obviously hardest on the homeowner, the renter, the business owner, the property owner—the people and businesses displaced by the hurricane and, later, the flood. They can't live at home. Their workplaces are closed, or the roads to get there are flooded. They suffer the direct losses from the immediate damage plus the indirect losses in income.
Insured Direct Losses
These victims are often insured against the direct losses, so insurance companies absorb a substantial share of the cost. For example, a house collapsed by a hurricane would be a covered peril. Some homeowners policies name specific perils included in the coverage, while other policies include all perils but note exceptions. Regardless of which type the homeowner has, wind and fire damage are covered; flood damage is not. And neither, by the way, is earthquake damage. In the case of fire and wind damage, depending on the type of policy a homeowner has, most if not all of the cost to rebuild the house would be covered. In addition, contents would also be covered, up to certain limits. Insured businesses would have similar coverage, and cars would be covered by comprehensive car insurance.
According to Dave Jones, California's insurance commissioner, insured claims arising from the California wildfires in October and December were nearly $12 billion. These included losses for homes and other types of dwellings but also cars, boats, and aircraft. Sonoma County had the largest number of claims for direct losses—21,286—for a total loss of nearly $8 billion.7 This doesn't count indirect losses, such as the loss of output from the affected wineries or the loss of tourism dollars.
Insured losses resulting from Hurricane Harvey more than doubled those of the California wildfires, coming in at $30 billion. However, insured losses were only a little more than one-third of the $85 billion in total losses.8 The discrepancy between insured and uninsured losses was, in part, due to the flooding caused by Harvey. Houston, the fourth largest U.S. city, endured the brunt of the storm. As Harvey became a tropical storm, it dumped a quantity of rain in some areas that would be expected only once every 1,000 years. More than 200,000 homes and 250,000 vehicles were damaged or destroyed by floods, but a water-damaged car is only covered if the owner carries comprehensive car insurance and, of course, flooding is not covered at all by the typical homeowners policy.9 Flood insurance must come from the National Flood Insurance Program (NFIP), and few homeowners and renters have it. In some cases, the insurance is required. People who have received grants or loans from the Federal Emergency Management Agency (FEMA) in the past for flooding must carry the insurance or risk having no assistance for future flood claims. Those who live in a flood zone and carry a mortgage are also required to have flood insurance. However, that wouldn't have helped much in Harris County. Flood zones are areas surrounding rivers. In Harris County, where Houston is located, only 17 percent of homeowners carried flood insurance. Most of the flooding there wasn't near a river, so few people were required to carry flood insurance.
FEMA Help with Direct Losses
Remember the coastal town? The wind damage was insured; the flood damage was not. This is where the federal government enters the picture. FEMA, an arm of the U.S. Department of Homeland Security, covers costs, including direct loans and loan guarantees to households and businesses. Even when most structures are insured, as in the case of the California wildfires, FEMA offers grants to pay for firefighting efforts and fire prevention. FEMA also offers other benefits that may not be covered by insurance.

Figure 1: FEMA Spending
This graph represents FEMA allocations, obligations, and expenditures as of February 28, 2018. Allocations are the amounts of money allocated to cover the expenses of a particular disaster. The obligations are the known expenses FEMA will pay, and the expenditures are the amounts of money FEMA has paid for the named disaster.
NOTE: Total obligations include prior year deobligations. The totals also include obligations for both major declarations and emergencies.
SOURCE: U.S. Department of Homeland Security. Disaster Relief Fund: Monthly Report as of February 28, 2018. Federal Emergency Management Agency, March 9, 2019. Financial information is from IFMIS.
Congress appropriates funds to FEMA, so ultimately, all taxpayers also share the costs (Figure 1). In 2017, FEMA issued 1,529 disaster declarations.10 Declarations are issued to counties, and each declaration can include up to four programs offered by the agency: Individuals and Households, Individual Assistance, Public Assistance, and Hazard Mitigation (see the boxed insert).

FEMA's Disaster Relief Fund appropriation from Congress was $7.3 billion for fiscal year 2017.11 As the number of disasters grew, however, it became clear that the FEMA budget was insufficient, and Congress issued a supplemental appropriation in excess of $15 billion.12 Then came the wildfires, and a little more than a month later, the House Appropriations Committee approved $36.5 billion more13 for disaster relief, the California wildfires efforts, and NFIP payments to individuals.
Businesses and Charitable Services Contributions
Insurance companies are obligated to cover insured perils. Government agencies are sometimes obligated and often expected to help in times of disaster. However, large sums of money can come from businesses, large and small. Immediately following Hurricane Harvey's ravaging of Houston, businesses pledged more than $157 million to help with relief and recovery.14 The costs of disasters are also shared by hundreds of charities that provide aid. The American Red Cross, for example, estimated its assistance to Harvey victims would total $318.5 million.15
Indirect Losses
It is too early to assess the extent of indirect costs stemming from the 2017 fires, floods, hurricanes, and tornadoes. For example, the wineries caught in the wildfires suffered direct losses of the structures and vines, but the interruption to their business, the indirect loss, is not clear. Most grapes had been harvested, but even for those grapes that survived on the vine, there was concern that the smoke and heat had severely damaged their quality.
Figure 2: Employment Still Below Pre-Katrina Level
NOTE: Gray bars indicate recessions as determined by the National Bureau of Economic Research (NBER).
SOURCE: U.S. Bureau of Labor Statistics. Retrieved from FRED®, Federal Reserve Bank of St. Louis. Accessed March 30, 2018.
Figure 3: Labor Force Still Below Pre-Katrina Level
NOTE: Gray bars indicate recessions as determined by the NBER.
SOURCE: U.S. Bureau of Labor Statistics. Retrieved from FRED®, Federal Reserve Bank of St. Louis. Accessed March 30, 2018.
As past experience shows, the effects of disasters can linger for years. Hurricane Katrina's effect on the New Orleans economy and environment during and after 2005 is a case in point. Employment in the New Orleans-Metairie, LA, metropolitan statistical area (MSA) has yet to rise to the pre-Katrina level (Figure 2), as thousands of residents that evacuated the city settled elsewhere permanently. The area's labor force is currently 603,883, still down from the pre-Katrina level of 632,826 (Figure 3).
Natural Disasters and GDP
With the loss of life, homes, businesses, capital, and infrastructure, it would be reasonable to expect a decline in economic growth after a disaster. New Orleans experienced severe economic disruption after Hurricane Katrina (Figures 4 and 5). Yet, the gross domestic product (GDP) of the New Orleans-Metairie, LA, MSA fell less than 3 percent before fully recovering to pre-Katrina levels in late 2007 (Figure 6). The economic recession of 2007-09 did far more damage to the local GDP than Hurricane Katrina.
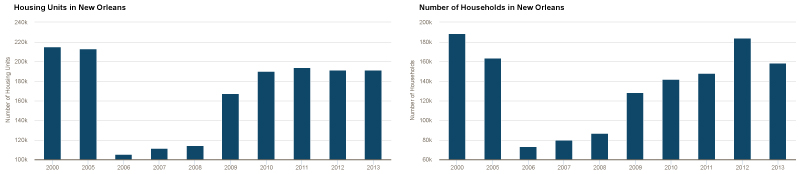
Figure 4: New Orleans Housing Units and Households Hadn't Recovered 5 Years After Hurricane Katrina
SOURCE: U.S. Census Bureau. English, E. "New Orleans, 10 Years after Katrina." Federal Reserve Bank of Atlanta Economy Matters, August 20, 2015; https://www.frbatlanta.org/economy-matters/2015/08/20/new-orleans-10-years-after-katrina.

Figure 5: Number of Businesses Surpassed Pre-Katrina Level by 2012
NOTE: CSA (combined statistical area), an area of two adjacent MSAs with connected labor markets.
SOURCE: U.S. Bureau of Labor Statistics. English, E. "New Orleans, 10 Years after Katrina." Federal Reserve Bank of Atlanta Economy Matters, August 20, 2015; https://www.frbatlanta.org/economy-matters/2015/08/20/new-orleans-10-years-after-katrina.
Figure 6: GDP Recovered to Pre-Katrina Level by 2008
NOTE: Gray bars indicate recessions as determined by the NBER.
SOURCE: U.S. Bureau of Economic Analysis. Retrieved from FRED®, Federal Reserve Bank of St. Louis. Accessed March 30, 2018.
Although in some ways New Orleans has not fully recovered, in many ways it has improved over pre-Katrina conditions. One striking improvement is in infrastructure in the form of raised levee walls and enormous flood gates. As building continues and population increases (Figure 7), housing and employment will increase.

Figure 7: New Orleans Population on the Rise
NOTE: The 2011, 2012, 2013, 2014, 2015, and 2016 population estimates have been revised with the release of the 2017 population estimates.
SOURCE: The Data Center analysis of U.S. Census Bureau Decennial Census and Population Estimates; https://www.datacenterresearch.org/data-resources/population-by-parish/.
Generally, a region's economic activity recovers after a natural disaster. Research suggests that only very large disasters that are followed by political upheaval have long-term negative effects on economic growth.16 GDP may fall in the short run, but reconstruction has a positive effect on GDP. Old capital is replaced with state-of-the-art capital that increases productivity. New buildings are constructed with energy efficiency in mind. People build new homes and replace personal property, such as furniture, appliances, and cars. Houston area automobile sales in the three weeks after Hurricane Harvey increased 109 percent over the three weeks prior to the storm.17 U.S. total vehicle sales spiked in September 2017 to the highest monthly sales figure since July 2005.18 U.S. retail sales of furniture and home furnishings climbed in October and November 2017.19
Conclusion
Natural disasters are painful and costly, and 2017 was particularly devastating in terms of loss of life and property damage. Direct losses are immediately apparent in the form of structures, vehicles, and furnishings that are flooded, burned, or blown to pieces. Everyone with a TV or computer is acutely aware of those losses. Indirect losses, on the other hand, are the lingering effects on income, business activity, and output that plague the afflicted area while recovery is taking place. Then there are the opportunity costs. For example, money spent to replace a bridge in a city is money that cannot be used to provide that city with new street lighting or to replace a worn out bridge in another city. As reconstruction begins, GDP may increase; but there is still loss. In the words of economist Frédéric Bastiat, "To break, to spoil, to waste, is not to encourage natural labour; or, more briefly, 'destruction is not profit.'"20
Notes
1 CA.gov. Thomas Fire Incident Information. Cal Fire, final update March 7, 2018.
2 Rice, D.; Sergent, J.; Petras, G. and Loehrke, J. "2017 Could Tie Record for Billion-Dollar Disasters in a Year. Here's Why." USA Today, October 18, 2017; https://www.usatoday.com/story/weather/2017/10/18/2017-could-tie-record-billion-dollar-disasters-year-heres-why/763406001/.
3 Hallegatte, S. and Przyluski, V. "The Economics of Natural Disasters: Concepts and Methods." Policy Research Working Paper 5507, The World Bank, 2010.
4 Hallegatte and Przyluski.
5 Hallegatte and Przyluski.
6 Hallegatte and Przyluski.
7 The actual loss was $7,839.473.04. California Department of Insurance. "Statewide Insured Losses from the October and December 2017 Wildfires." January 21, 2018; http://www.insurance.ca.gov/0400-news/0100-press-releases/2018/upload/nr013-2018WildfiresUpdate013118.pdf.
8 Ellenrieder, T. "Hurricane Harvey: Record-Breaking Floods Inundate Houston." Munich RE Group. January 12, 2017; https://www.munichre.com/topics-online/en/2017/12/hurricane-harvey.
9 Ellenrieder.
10 FEMA Declaration Set – Data As Of: 3/6/18. Data.gov. FEMADeclarations.3.6.18.
11 U.S. House of Representatives Committee on Appropriations. "Appropriations Committee Releases Fiscal Year 2017 Homeland Security Bill." Press release, June 8, 2016; https://appropriations.house.gov/news/documentsingle.aspx?DocumentID=394583.
12 U.S. House of Representatives Committee on Appropriations. "Emergency Disaster Aid and Continuation of Government Funding Approved." Press release, September 8, 2017; https://appropriations.house.gov/news/documentsingle.aspx?DocumentID=395049.
13 U.S. House of Representatives Committee on Appropriations. "House Appropriations Committee Moves Emergency Hurricane and Wildfire Legislation." Press release, October 10, 2017; https://appropriations.house.gov/news/documentsingle.aspx?DocumentID=395054.
14 Yurieff, K. "Businesses Donate Over $157 Million to Harvey Relief Efforts." CNN Money, September 3, 2017; http://money.cnn.com/2017/08/30/news/companies/hurricane-harvey-corporate-donations/index.html.
15 American Red Cross. "Massive Red Cross Response Continues in Wake of Unprecedented Flooding. Hurricane Harvey One-Month Update." October 2017.
16 Cavallo, E.; Galiani, S.; Noy, I. and Pantano, J. "Catastrophic Natural Disasters and Economic Growth." Review of Economics and Statistics. December 2013, 95(5), pp. 1549-61.
17 Rocco, M. "Houston Car Sales Spike After Harvey." Fox Business, October 3, 2017; https://www.foxbusiness.com/markets/houston-car-sales-spike-after-harvey.
18 U.S. Bureau of Economic Analysis. Total Vehicle Sales. Retrieved from FRED®, Federal Reserve Bank of St. Louis; https://fred.stlouisfed.org/series/TOTALSA, accessed March 30, 2018.
19 U.S. Bureau of the Census. Retail Sales: Furniture and Home Furnishings Stores. Retrieved from FRED®, Federal Reserve Bank of St. Louis Fed; https://fred.stlouisfed.org/series/MRTSSM442USS, accessed March 30, 2018.
20 Bastiat, F. "That Which is Seen, and That Which is Not Seen." July 1850; http://bastiat.org/en/twisatwins.html.
© 2018, Federal Reserve Bank of St. Louis. The views expressed are those of the author(s) and do not necessarily reflect official positions of the Federal Reserve Bank of St. Louis or the Federal Reserve System.
Glossary
Asset: A resource with economic value that an individual, corporation, or country owns with the expectation that it will provide future benefits.
Gross domestic product (GDP): The total market value, expressed in dollars, of all final goods and services produced in an economy in a given year.
Insurance: Protection from specified losses in return for a fee (premium).
Loan guarantee: A contract binding a third party to pay off a loan if the borrower defaults.
Metropolitan statistical area (MSA): A densely populated geographic region, with a city at its core, having strong economic ties.
Opportunity cost: The value of the next-best alternative when a decision is made; it's what is given up.
Peril: In insurance, a specific risk or cause of loss.
Positive externality: A benefit to a third party arising from a transaction between two unrelated parties.