
Measures of “Trend” Inflation
In January 2012, the Federal Open Market Committee (FOMC) adopted a 2% inflation target. The inflation target they chose was based on the percentage change in the all-items (headline) personal consumption expenditures price index (PCEPI). The FOMC noted that deviations from the 2% target rate were likely in response to economic and financial developments, but that under appropriate monetary policy, inflation would average 2% over the longer run. In conventional models of inflation, the 2% inflation target rate—if credible—becomes a reasonable proxy for trend inflation and helps anchor long-run inflation expectations.
Over time, then, under a credible monetary policy, headline inflation should converge to its long-run trend rate, which is primarily determined by the monetary authority. Thus, the FOMC attempts to measure trend inflation because it is a potentially useful guideline for predicting future inflation over the time horizon the FOMC cares about (typically 1 to 3 years). Many FOMC members view core PCEPI as an acceptable measure of trend inflation, as it excludes food and energy prices from the all-items PCEPI.
Economists have long strived to measure trend inflation. Measures of the trend rate have ranged from the simple (e.g., core inflation, which was first calculated in the early 1970s) to the sophisticated (e.g., the New York Fed's Multivariate Core Trend model).
But there are other measures of trend inflation that many economists have used as an alternative to core PCEPI. The figure plots the following six PCEPI-based trend measures since January 2012 (the inflation rate is measured as 12-month percent changes):
- The Federal Reserve Bank of Cleveland's Median PCE;
- The Federal Reserve Bank of Dallas's Trimmed Mean PCE;
- The Federal Reserve Bank of New York's Multivariate Core Trend;
- The Federal Reserve Bank of San Francisco's Acyclical core PCE;
- The Federal Reserve Bank of San Francisco's Cyclical core PCE; and
- The Bureau of Economic Analysis (BEA) PCE price index for core services that excludes housing.
A detailed discussion of each series may be found at the links provided. The sixth index, which is derived from PCE data published by the BEA, was cited by Fed Chair Jerome Powell at the December 14, 2022, FOMC press conference: He stated it is one measure of core inflation that he was following closely because he viewed the measure as significantly influenced by the strength of the labor market.

As seen in the figure, the various measures of trend inflation can deviate considerably over time. Thus, policymakers may find it difficult to extract a reliable signal from each of these measures. For example, before the pandemic, some measures exceeded the 2% inflation target and some were below the target rate. One simple, alternative way to measure trend inflation is by calculating the geometric mean of the series. This series is also shown in the figure. The alternative trend inflation rate averaged 1.86% over the pre-pandemic period, which was closer to the FOMC's 2% inflation target than the core PCEPI inflation rate, which averaged 1.66%. By this metric, the geometric mean measure might thus be a good proxy for trend inflation.
Since the onset of the pandemic in March 2020, all measures of trend inflation have increased sharply. Moreover, there appeared to be much less variability—but with two exceptions: The San Francisco Fed's two series, which have moved in opposite directions over the past year.
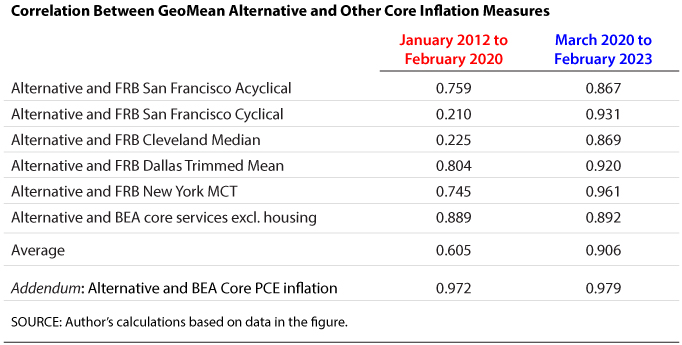
The table shows correlations between the alternative (geometric mean) measure and each of the six trend inflation measures noted above for the pre- and post-pandemic periods: (1) January 2012 to February 2020; and (2) March 2020 to February 2023. In the pre-pandemic period, the alternative measure has a low correlation coefficient with the San Francisco Fed's Cyclical measure and the Cleveland Fed's Median PCE measure. (These coefficients indicate a stronger positive correlation the closer they are to 1.0 and a stronger negative correlation the closer they are to –1.0.) The correlation with the other series are relatively high. This finding suggests that in the pre-pandemic period, there was some commonality across the trend inflation measures.
However, since the onset of the pandemic, there has been much more commonality—what economists call co-movement—across all of the series. The correlations between the alternative and the other measures range from 0.867 for the San Francisco Fed's Acyclical measure to 0.961 for the New York Fed's Multivariate Core rate. The average correlation between the alternative and the six trend series increased from 0.61 in the pre-pandemic period to 0.91 in the post-pandemic period.
The final line in the table shows the correlation between the alternative measure and the core PCEPI inflation rate. In both periods, the correlation is very high, exceeding 0.97. On the face of it, this finding suggests that the core PCEPI inflation rate does a reasonably good job of capturing the information contained in the alternative (geometric mean) measure.
A final conclusion that one might draw from the chart is that both the alternative and the core PCEPI tend to be "sticky". That is, they tend to rise and fall at a much slower rate than headline inflation. If this trend continues, the headline inflation rate will not continue to fall unless there are persistent declines in the non-core or non-trend measures of inflation.
© 2023, Federal Reserve Bank of St. Louis. The views expressed are those of the author(s) and do not necessarily reflect official positions of the Federal Reserve Bank of St. Louis or the Federal Reserve System.