
Inflation, Part 1: What Is it, Exactly?
As prices rise globally at rates unseen since the late 1970s, inflation has become a broad issue in many developed economies. In the United States, consumers, market participants, and policymakers expect inflation well above the Federal Reserve's 2% target through at least 2023.
The news is filled with a dizzying array of numbers and acronyms on the subject: 8.3% CPI,1 6.3% PCE,2 11% PPI.3 What do these numbers mean? Why do they differ? What is "inflation," exactly, and how does it relate to prices consumers actually see? This essay is the first in a series explaining inflation—its definition, its measurement, and its importance. Today, we focus on our most fundamental question: What is inflation?
Price Level, Price Changes
To define inflation, we must first discuss price indexes. A price index is a measure of the average price of a collection of goods and services. How this collection (or "basket") of goods and services is constructed—what items are included and how many of each—differs depending on the prices an index is trying to capture. The most familiar indexes—the Bureau of Labor Statistics' consumer price index (CPI) and the Bureau of Economic Analysis's personal consumption expenditures (PCE) price index—capture consumer prices in slightly different ways, which we will discuss further in Part 2. Other indexes, such as the Bureau of Labor Statistics' producer price index (PPI), focus on other prices altogether, such as those faced by manufacturers.
Inflation measures the rate of change of a price index over time. This change is often expressed as a year-over-year percent change (e.g., the percent prices increased in April 2022 relative to April 2021). While price indexes measure price levels, inflation measures price changes. This distinction is important. Inflation can be constant—or even declining—while prices increase. Even if inflation declines later this year (which most forecasters expect), prices will remain high and go higher—just at a slower rate. While individual prices can fall from time to time, it is rare for the overall price level (measured by a price index) to decline; this would require negative inflation ("deflation"), something monetary policymakers try to avoid.4
An Analogy: Commuting to Work
Consider someone getting on and off the highway as they drive to work. The table shows the driver's speed and acceleration in five-minute intervals, with acceleration calculated as the percent change in their speed over the previous five minutes. We can think of the driver's speed as a price index and acceleration as inflation.
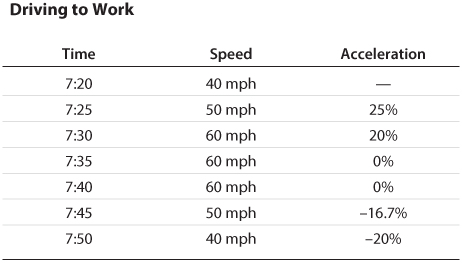
The example can be broken into three instructive periods: acceleration, cruising, and deceleration.
From 7:25 to 7:30, acceleration (calculated as the percent change in initial speed) declines, despite speed increasing. If this were about prices, we would say that inflation is "declining" or "moderating" despite the overall price level increasing.
From 7:35 to 7:40, acceleration stops, and the driver's speed remains constant. Again, if this were about prices, we would say that inflation is zero—in which case prices remain constant and don't decline.
From 7:45 to 7:50, the driver exits the highway and slows down; acceleration is negative (i.e., there is deceleration) as the vehicle speed declines. Likewise, prices only decline when inflation is negative (i.e., there is deflation).
When it comes to driving, this last period is inevitable—people can't drive forever! But the analog—deflation—is extremely rare for price indexes, which tend to only go up. Prices also differ from driving in another important way. While traffic authorities care about drivers' speed (giving out tickets to those going too fast, regardless of how fast they accelerated to that speed), monetary policymakers focus on inflation in their mission to maintain stable prices.
Back to Inflation and Price Indexes
It may be useful to more explicitly review the relationship between prices and inflation under a variety of circumstances. The figure shows the effect on prices due to zero, constant, increasing, and decreasing inflation.
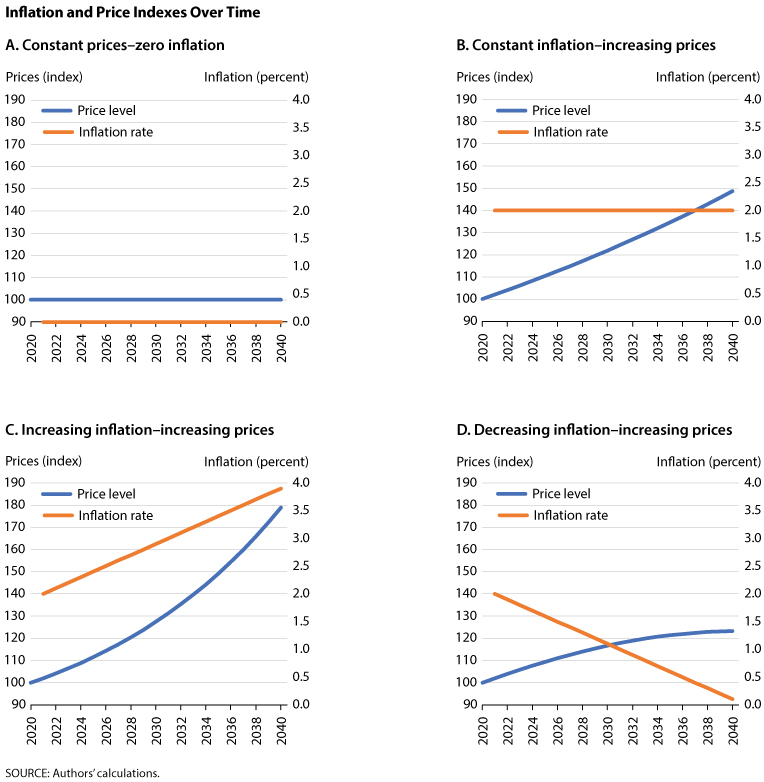
Panel A shows that if inflation were zero over two decades, prices should remain constant (at the normalized value of 100). Panel B shows that even a small amount of inflation (i.e., 2%) can have a dramatic effect on how prices grow over two decades—increasing them by nearly 50%. The growth in prices is compounded over time: This is why the change in prices is higher in the last decade (i.e., 2030 to 2040) than in the initial decade (i.e., 2020 to 2030).
Panels C and D highlight the effects of non-constant inflation on prices. The price level either nearly doubles or increases less than 25%, depending on whether inflation itself grows to 4% or shrinks to 0% in the span of 20 years.
These examples do not cover the case of negative inflation (deflation), which would involve price indexes declining. One can imagine extending Panel D: If inflation continued to decline into negative territory, the price level would continue to curve downward—forming a wide hump shape, as prices would first increase more and more slowly—before stopping and then shrinking more and more quickly.
All this analysis, of course, takes a given price index for granted. In reality, the calculation of a given index involves a series of complex (and inevitably critiquable) decisions. (Why else would there be two well-publicized indexes for consumer prices [the CPI and PCE]?) In Part 2, we will review the construction of these indexes in detail. In Part 3, we will review how the Fed views its mandate of "stable prices" according to these indexes, and how well it has historically done achieving that mandate.
Notes
1 Cox, Jeff. "Inflation Barreled Ahead at 8.3% in April from a Year Ago, Remaining Near 40-Year Highs." CNBC, May 11, 2022; https://www.cnbc.com/2022/05/11/cpi-april-2022.html.
2 Bartash, Jeffry. "U.S. Inflation Rate Slows to 6.3%, Fed-Favored PCE Gauge Shows, in a Sign that Price Pressures Could Be Peaking." Market Watch, last updated May 28, 2022; https://www.marketwatch.com/story/u-s-inflation-rate-slows-to-6-3-pce-shows-in-sign-price-pressures-could-be-near-peak-11653655258.
3 Guilford, Gwynn. "Producer Price Gains Slowed in April But Remained Elevated." Wall Street Journal, updated May 12, 2022; https://www.wsj.com/articles/producer-price-gains-edged-downward-in-april-but-remain-elevated-11652360313.
4 See Federal Reserve Bank of San Francisco. "What Is Deflation, What Are the Risks of Deflation, and How Can the Fed Combat Deflation?" May 2003; https://www.frbsf.org/education/publications/doctor-econ/2003/may/deflation-risks/.
© 2022, Federal Reserve Bank of St. Louis. The views expressed are those of the author(s) and do not necessarily reflect official positions of the Federal Reserve Bank of St. Louis or the Federal Reserve System.