
Putting Recent Inflation in Historical Context
The April 2021 consumer price index (CPI) inflation report caused some consternation in financial markets. Headline inflation for April was 4.2 percent, which is a significant overshoot of the Federal Reserve's (Fed's) stated average inflation target of 2.0 percent. Although the Fed uses a personal consumption expenditures (PCE) inflation target, CPI inflation is highly correlated with that PCE target and is seen as a leading indicator of PCE inflation.1 Policymakers acknowledge that the April inflation report is likely picking up transitory effects, as April 2021 prices are compared with April 2020 prices; these were depressed during the height of the pandemic, especially for items such as restaurants, fuel, and hotels. However, the inflation report has stoked fears that the combination of recent fiscal stimulus and accommodative monetary policy has spurred higher prices.
In this essay, we put 4.2 percent CPI inflation in historical context. We first compare the April inflation report with others over the past 60 years. Second, we examine whether volatile food and fuel prices or more broad-based factors are driving the recent inflation numbers. Finally, we investigate the size of the April inflation report relative to historical changes.

Figure 1 plots the distributions of CPI inflation—percentage changes from the previous year—for three different periods in monetary history: 1960 to the present, 1960-95 or the "pre-inflation targeting" era, and 1995 to the present or the "inflation targeting" era.2 The vertical black line in the figure represents the April 2021 inflation reading.
A Basic Historical Context. Figure 1 demonstrates that, depending on the period you consider, the April 2021 inflation report is considered either usual, higher than usual, or a statistical outlier. Compared with the 1960-2021 distribution (the blue distribution in Figure 1), an annual price increase of 4.2 percent is greater than the mean of 3.7 percent but well within a normal historical range. Compared with the pre-inflation targeting period of 1960-95 (the red distribution in Figure 1), a 4.2 percent price increase is less than the mean of 4.8 percent but greater than the median, again implying a very typical level of inflation. However, since the Fed adopted inflation targeting, starting around 1995 (the green distribution in Figure 1), an annual price increase of 4.2 percent is highly unusual and has been observed less than 3 percent of the time.
Inflation and Volatile Components. The CPI index contains several items with volatile prices that, in the short run, are not determined by monetary policy—including gasoline and food prices. Policymakers often prefer to focus on "core" measures of inflation, which generally refer to price measures that exclude these volatile components.
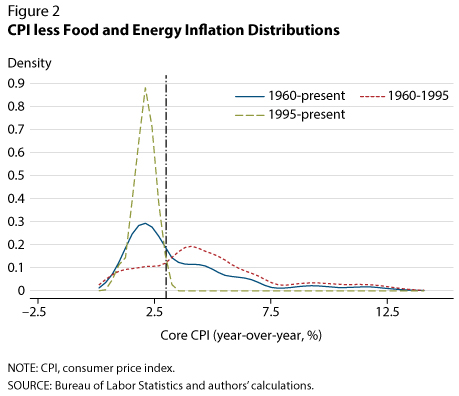
Did volatile food and fuel prices drive the large CPI increase in April 2021? To address this question, we examine inflation distributions in monetary periods where we use the CPI index less food and fuel items. Figure 2 plots the CPI index less food and fuel inflation distributions over different periods. In April 2021, core CPI increased 3.0 percent from the previous year. Compared with the 1960-95 distribution, a reading of 3.0 percent price increases is greater than the mean inflation rate but unremarkable. In the post-1995 inflation-targeting era, a core CPI increase of 3.0 percent is approximately the largest inflation reading, implying food and fuel prices are not driving the recent inflation spike.

Inflation Surprises. Another way to think of inflation this month is how much of a "surprise" or deviation the inflation report was from the prior month. Figure 3 plots the distribution of CPI inflation changes from the prior month, which makes distributions consistent across periods. The April inflation report is highly unusual for any period. The vertical line represents the April increase of 1.6 percentage points relative to March. Its location on the far-right tail of the distribution suggests there have been very few reports in which inflation so far outstripped that from previous months.
Should the April CPI report cause concern? While the analysis in this article establishes that the April 2021 inflation report is one of the highest inflation readings since the Fed instituted inflation targeting in the mid-1990s, there are other factors at play. As inflation is measured as the percentage change in the price of a basket of goods from the prior year, by construction the April inflation report is comparing prices in 2021 with depressed prices from April 2020, which was during the COVID-19 lockdown. While the April 2021 inflation report is undeniably historically high, it also follows an unprecedented turbulent period for the economy for which the historical evidence might provide imperfect guidance.
Notes
1 See Haubrich (2014) for a discussion of the differences in CPI and PCE inflation: https://www.clevelandfed.org/newsroom-and-events/publications/economic-trends/2014-economic-trends/et-20140417-pce-and-cpi-inflation-whats-the-difference.aspx.
2 A previous post examined how well the Federal Reserve has achieved its explicit dual mandate since it has adopted inflation targeting: https://research.stlouisfed.org/publications/economic-synopses/2021/01/29/a-simple-evaluation-of-two-decades-of-inflation-targeting-lessons-for-the-new-monetary-policy-strategy.
© 2021, Federal Reserve Bank of St. Louis. The views expressed are those of the author(s) and do not necessarily reflect official positions of the Federal Reserve Bank of St. Louis or the Federal Reserve System.