
Lagging Long-Term Wage Growth
The U.S. economy has experienced a slow job recovery since the 2007-09 financial crisis. As the unemployment rate finally fell below 6 percent in the last quarter of 2014, concerns about the state of the economy gradually shifted to wage growth. Instead of focusing on wage growth during the years since the financial crisis, in this essay we examine long-term wage growth since 1972. Specifically, we see if wages have kept pace with overall growth in the economy by comparing hourly wage growth with per capita gross domestic product (GDP) growth.
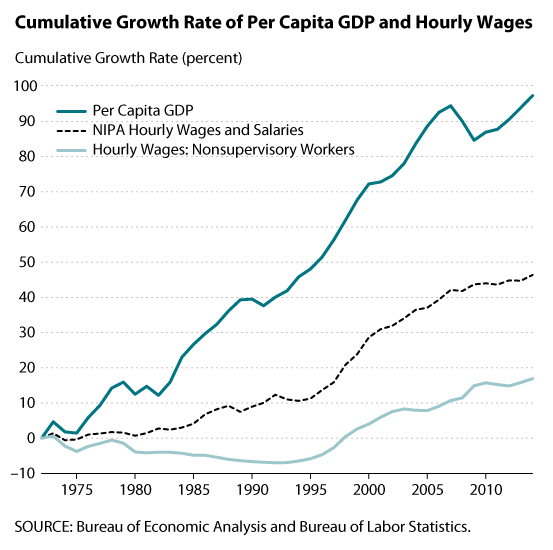
We compare GDP data from the National Income and Product Accounts (NIPA) and two hourly wage data series. The first data series is from the Bureau of Labor Statistics establishment survey, which reports the average hourly wage for all nonsupervisory workers.1 To check for robustness, we also compute a second hourly wage series by dividing the total wages and salaries reported in NIPA by the total hours worked from the establishment survey data. Finally, we deflate all nominal price data, including nominal GDP data, to real GDP data using the personal consumption expenditures (PCE) price index.
We find that the growth rate of hourly wages consistently lags behind per capita GDP growth. This result is clearly indicated by the figure, which plots the cumulative growth rate of our two hourly wage series and per capita GDP since 1972. Over the past 42 years, the real hourly wage rate has increased by only 17 percent and 46 percent for our first and second wage series, respectively, while per capita GDP grew much more, almost doubling. Moreover, real wages grew very little (series 2) or even experienced negative growth (series 1) for a long period until the mid-1990s.
There is a major difference between the composition of workers in the first and second wage series. The first series consists of only nonsupervisory workers, whereas the second series covers all workers including supervisory workers. Hence, the higher growth in the second series indicates that the wage growth should be stronger among supervisory workers. This finding is consistent with the empirical finding that high-wage earners account for most of the wage growth.
There are two reasons the wage growth rate has lagged behind per capita GDP growth:
(i) The growth rate of hours worked is stronger than the growth rate of the population. The higher growth in hours worked is due mainly to the increase in labor participation in the 1970s and 1980s. The average growth rates of total hours worked and the population in our sample period are 1.31 percent and 0.99 percent, respectively. Therefore, the hourly wage growth is slower than per capita GDP growth.
(ii) The average growth rate of total GDP is higher than the average growth rate of the total real wage to workers. Average total real GDP grew at 2.59 percent, while average total real wages grew at a lower rate, 2.21 percent. Given that total GDP is divided between laborers and capital owners, this fact suggests that a higher share of income went to capital owners over time.
Our results suggest that the long-run trend of average wages has consistently failed to keep pace with overall economic growth. In addition, the cyclical component of wage growth seems to play an insignificant role compared with the overall trend. If this trend continues, strong real wage growth may not occur even if economic conditions improve.
Note
1 Nonsupervisory workers are those who are not capital owners or who are not primarily employed to direct, supervise, or plan the work of others; see http://www.bls.gov/web/empsit/cesfaq.htm.
© 2015, Federal Reserve Bank of St. Louis. The views expressed are those of the author(s) and do not necessarily reflect official positions of the Federal Reserve Bank of St. Louis or the Federal Reserve System.