
Oil Prices: Is Supply or Demand Behind the Slump?
Oil prices have dropped more than 50 percent since mid-2014. Establishing whether demand or supply factors lie behind this slump is possibly useful for understanding its potential impact on the economy.
We set out to replicate a leading statistical decomposition of the factors affecting oil prices found in the economics literature. We followed the methodology in Lutz Kilian's 2009 paper "Not All Oil Price Shocks Are Alike: Disentangling Demand and Supply Shocks in the Crude Oil Market," a highly cited empirical paper about oil prices and macroeconomic variables.
The model used in that paper consists of a structural vector autoregression.1 The model includes three variables: (i) global crude oil production, (ii) global real economic activity (measured as a global index of freight rates), and (iii) real crude oil prices.
Three economic assumptions are used to break innovations in the three variables into three "structural shocks." These shocks impact the dynamical system of the three variables, vary independently of each other, and are assigned a particular economic interpretation: First, supply shocks are the unpredictable component of changes in crude oil production. Second, aggregate demand shocks are the unpredictable component of changes in real economic activity that cannot be explained by supply shocks (as defined above). Third, oil-specific demand shocks are the unpredictable component of changes in the real price of oil that cannot be explained by either supply shocks or aggregate demand shocks.
In Kilian's analysis, the supply shocks are interpreted as measuring the current physical availability of crude oil and the aggregate demand shocks are interpreted as measuring the global business cycle. The third type of shocks, referred to as oil-specific demand shocks, are interpreted as measuring changes in the demand for oil driven by precautionary motives. According to Kilian, concerns about unexpected growth of demand or declines in supply, or both, could lead to increases in the demand for oil inventories—as insurance. Further, these precautionary motives can fluctuate independently of the business cycle and the current availability of crude oil. Mechanically, however, these shocks are obtained as a residual: innovations to oil prices that cannot be explained by changes in global economic activity or changes in oil supply.
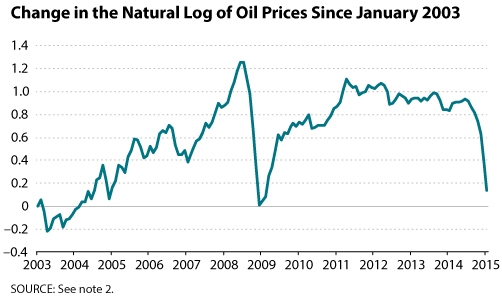
In this synopsis, we update the dataset used in Kilian's article and repeat the econometric analysis based on the replication codes provided with that article.2 The estimation period is January 1973 to January 2015. The first figure shows the change in the natural log of oil prices with respect to the log price observed in January 2003.

The second figure shows the components of total variation in the log of oil prices since January 2003 that is explained by each type of shock and the initial conditions. Adding these components produces the overall change plotted in the first figure. The initial conditions correspond to the data on oil supply, economic activity, and oil prices between January 2001 and December 2002. These data pin down the state of the dynamic system at the beginning of January 2003.
The figures tell the following story: Between 2003 and mid-2008, aggregate demand shocks induced a run-up in oil prices. During the 2008 financial crisis, negative oil-specific demand shocks together with negative aggregate demand shocks caused a sharp decline in the price of oil. Following the financial crisis, positive oil-specific demand shocks and negative aggregate demand shocks resulted in roughly constant oil prices. After mid-2014, the lion's share of the decline in oil prices has been caused by negative oil-specific demand shocks and, to a lesser extent, by negative aggregate demand shocks. In contrast, the role of the oil supply (understood as the current physical availability of crude oil) has been small.
Notes
1 For basic information on vector autoregression, see http://en.wikipedia.org/wiki/V....
2 Data on world crude oil production through November 2014 are from the U.S. Energy Information Administration (EIA). We impute the December 2014 and January 2015 data points using total oil production data from the International Energy Agency's Oil Market Reports. The updated index of real economic activity for January 1973 to January 2015 is from http://www-personal.umich.edu/~lkilian/reaupdate.txt. The monthly nominal oil prices through January 2015 are from the EIA.
Reference
Kilian, Lutz. "Not All Oil Price Shocks Are Alike: Disentangling Demand and Supply Shocks in the Crude Oil Market." American Economic Review, June 2009, 99(3), pp. 1053-69.
© 2015, Federal Reserve Bank of St. Louis. The views expressed are those of the author(s) and do not necessarily reflect official positions of the Federal Reserve Bank of St. Louis or the Federal Reserve System.