
Modeling Professional Recession Forecasts
The possibility of recession has been in the news recently. Many observers have noted warning signs of a recession, such as an inverted yield curve and volatile oil prices, while other indicators give hope for a soft landing. Although statistical models and professional forecasts imply a much-higher-than-normal probability of recession, there is still a lot of uncertainty about the outcome.
Professional forecasters synthesize many types of information to predict future economic quantities, such as GDP or inflation, and they often assess the uncertainty associated with their predictions. In the case of recession prediction, for example, forecasters estimate the likelihood of a recession within the next 12 months. As of August 2023, a typical estimate of the probability of a US recession within 12 months is about 60%, and it has been above 50% since October 2022.
While economic forecasters don't have crystal balls and can only assign probabilities to various outcomes, their forecasts contain enough information for major corporations and organizations to purchase them. This raises questions: What variables do forecasters look at? How do these variables translate into forecasts?
One could investigate forecast methods, but forecasters are naturally reluctant to publicly detail their methods. In addition, professional forecasters often supplement many sorts of statistical methods with their own judgment to account for special circumstances, such as unusual weather or changes to tax laws or financial regulations. These facts make it difficult to define forecasting techniques.
An alternative to directly studying forecast methods would be to replicate forecasts using public information. In other words, instead of predicting output growth, inflation, probability of recession, or some other variable, one might try to replicate the past forecasts of the variable using public data.
This essay investigates what variables professional forecasters appear to use to predict the probability of recession in the next 12 months. We obtain our target variable—the estimated probability of a US recession within 12 months—from Consensus Economics, which surveys economic forecasters and reports the results of their surveys as historical data series. The series for the estimated recession probability forecasts is currently available from May 2006 through August 2023.
To replicate the Consensus Economics probability-of-recession series, I choose 12 monthly and three quarterly variables that might be predictive of recession. For simplicity, I counterfactually assume that each variable is publicly known in the month or quarter. I transform each of these 15 variables in four ways: as a level, a 3-month moving average, a year-over-year percentage change, and a year-over-year percentage change in the 3-month moving average. This procedure produces a total of (15*4 =) 60 explanatory variables. Allowing for transformations is necessary because a variable's form can be important in determining its ability to predict other variables. For example, in some models, the unemployment rate might predict changes in inflation but not inflation itself.
Although there are potentially many ways to employ these 60 variables to replicate the estimated recession probability, I will initially keep things simple and model the probability of recession with a nonlinear "probit" model using each of the 60 variables individually. Note that I am not predicting recessions with the 60 variables, but the Consensus Economics probability of recession. Then I will assess the importance of each predictive variable by the squared correlation of its prediction with the recession probability.1 This assumes that forecasters are more likely to use variables to predict recessions if those variables are more highly correlated with the probability of recession.

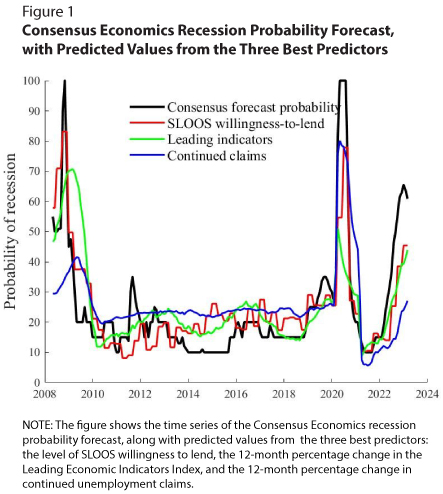
The table shows the best 10 explanatory variables in the best transformation of each variable. The top three variables are the willingness-to-lend variable from the Senior Loan Officer Opinion Survey (SLOOS), the Leading Economic Indicators index, and continued unemployment claims.2 These variables have respective squared correlations of 0.69, 0.44, and 0.41 with the Consensus Economics recession probability. The bottom row of the table shows that the squared correlation of the recession probability with the predicted value rises to only 0.72 when simultaneously using the top three predictors. Figure 1 shows that predicted values from each of the three best predictors tend to move fairly well with the Consensus Economics recession probability. The importance of all transformations of the SLOOS willingness-to-lend variable is consistent with the key role of financial conditions in recession forecasting, but it also highlights the unrealistic assumption that its value would be known within the quarter.

Curiously, yield spreads are not among the best 10 predictors, though they have a stellar record in predicting recessions. Figure 2 shows the predicted value of the recession probability from the 10-year-3-month yield spread and the near-term yield spread. Although all these variables are useful when forecasting recessions, they do not explain the Consensus Economics estimated probability of recession very well. The short length of the sample might fail to illustrate the full effectiveness of yield spreads, which have been perennial performers since the 1950s.
Notes
1 If I had used the 60 predictors in linear models, I could have simply calculated the squared correlation of each predictor with the recession probability.
2 The SLOOS variable was a good predictor of the recession probability in all four of its forms; it describes senior bank loan officers' self-reported willingness to lend for consumer loans in a quarterly Federal Reserve survey. The Conferences Board publishes the monthly Leading Economic Index, which comprises three financial and seven non-financial components that have been observed to lead historical business cycles. Continued unemployment claims is a weekly count of filings for unemployment benefits by people who had also filed the previous week. I converted the weekly data to monthly variables by simply averaging the weeks within a calendar month.
© 2023, Federal Reserve Bank of St. Louis. The views expressed are those of the author(s) and do not necessarily reflect official positions of the Federal Reserve Bank of St. Louis or the Federal Reserve System.