
Personal Saving During the COVID-19 Recession
The year 2020 was unusual in many ways, including this one: The personal saving rate skyrocketed at the start of the COVID-19-induced recession. The personal saving rate is important for many reasons: Large changes in savings can have big effects on financial markets. Additionally, the personal saving rate might reflect individuals' expectations about the duration of a recession. People are likely to save more when they expect an economic downturn to last for a long time—the "precautionary" motive for saving. If the downturn is not expected to last, people are likely to use their savings to maintain their consumption; that is, they will keep paying their rent, mortgage, utility bills, etc.
Figure 1
The Personal Saving Rate
SOURCE: FRED®, Federal Reserve Bank of St. Louis; https://fred.stlouisfed.org/graph/?g=AwzQ.
Figure 1 shows the U.S. personal saving rate. Shaded areas indicate recessions dated by the National Bureau of Economic Research. The figure offers three points to focus on: First, with the notable exception of 2020, the saving rate changes slowly over time. It was stable in the 1960s and 1970s, declined from the late 1970s until the first half of the 2000s, and then increased again. From 1959 to 2019, the saving rate remained mostly within 4 or 5 percentage points of its 11.8 percent average. Second, the saving rate sometimes increased during recessions, such as at the start of the 2007-09 recession, but these fluctuations were not much larger than other fluctuations. Third, the saving rate jumped to an abnormally high level in 2020, reaching almost 35 percent. It immediately started a rapid decline but remains high relative to historical averages.
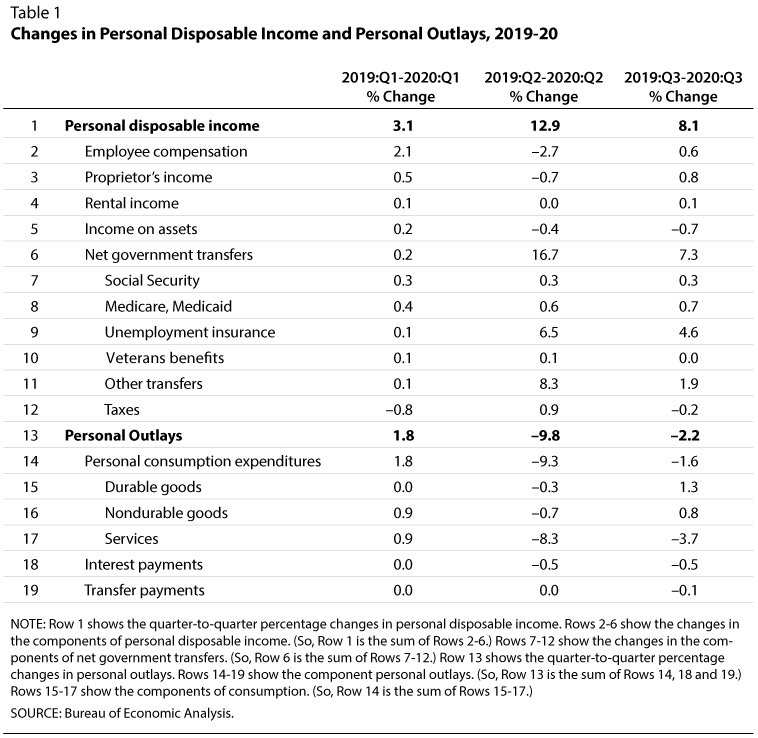
What components of the saving rate contributed to the recent jump? Table 1 shows the quarter-to-quarter percentage changes in personal disposable income and personal outlays between 2019 and 2020. Disposable income increased noticeably during the second and third quarters of 2020 relative to those quarters in 2019: by 12.9 percent in the second quarter and 8.1 percent in the third quarter. In contrast, it increased by 3.1 percent during the first quarter of 2020, which is lower than the 4.4 percent average quarter-to-quarter change since 2015 (not shown in the table).
Table 1 also shows the contributions of the components of disposable income to its growth rate. During the second quarter of 2020, the pandemic-induced slowdown in economic activity reduced employee compensation by 2.7 percentage points. Other types of income decreased at lower rates. The significant growth in disposable income is thus entirely due to net transfers, which contributed 16.7 percentage points during the second quarter of 2020 and 7.3 percentage points during the third quarter. Further decomposition of the change in net transfers show the dominant roles of unemployment insurance and other transfers, such as stimulus checks.
In contrast to disposable income, personal outlays declined during the second and third quarters of 2020. The declines were mostly driven by personal consumption expenditures in the second and third quarters, and the decreases in those expenditures were mostly driven by the declines in services. Note that all the components of consumption decreased during the second quarter of 2020, whereas during the third quarter only services declined. Whether the decline in consumption resulted from more saving or less buying due to the shutdown of many services (e.g., restaurants) cannot be assessed from the data in Table 1.
The saving rate increased, therefore, for two distinct reasons: higher personal disposable income and lower personal spending. The former was fueled mostly by government net transfers and the latter by reducing the consumption of services.
Figure 2
Personal Savings and Net Government Savings as a Percent of GDP
SOURCE: FRED®, Federal Reserve Bank of St. Louis; https://fred.stlouisfed.org/graph/?g=AHnl.
Figure 2 implies that the increase in income benefited U.S. households and came mostly from an increase in transfers, which the federal government finances by borrowing. Thus, the increase in personal saving mirrors the increase in government borrowing. If U.S. households recognize that their government benefits will raise government debt and their future taxes, then they may have rationally decided to save most or all of those benefits to pay those future taxes.
© 2021, Federal Reserve Bank of St. Louis. The views expressed are those of the author(s) and do not necessarily reflect official positions of the Federal Reserve Bank of St. Louis or the Federal Reserve System.