
The Mechanics of Fed Balance Sheet Normalization
The Federal Open Market Committee (FOMC) began reducing the size of the Federal Reserve's balance sheet in June 2022. This policy, termed balance sheet "normalization" or "quantitative tightening" (QT), is designed to drain excess liquidity from the banking system. QT is the opposite of quantitative easing (QE). This essay looks at where the Fed stands in terms of QT and what should be considered going forward.
Assets on the Fed's balance sheet reached an historic peak of $8.96 trillion in April 2022 (36% of GDP), following expansionary policies designed to mitigate the negative economic effects of the pandemic. Since then, the Fed has reduced its assets by $757 billion (Figure 1), in part from QT that started in June. The Fed's current balance sheet normalization is its second (QT-II) in less than a decade.
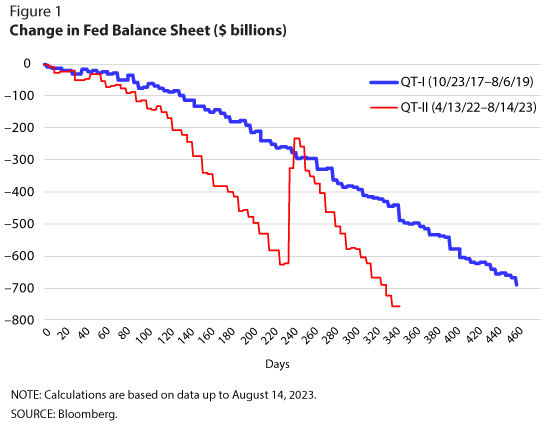
The first QT (QT-I) began in October 2017, after the economy recovered from the global financial crisis. In response to the crisis, the Fed had implemented several large-scale asset purchases that increased the Fed's balance sheet. As seen in Figure 1, QT-I reduced the Fed's balance sheet (or aggregate liquidity) by a little less than $700 billion by August 2019, when it ended.
However, in September 2019, money market pressures developed as bank reserves dropped to less than $1.4 trillion (about 7% of GDP). In response to the ensuing financial market stresses, the FOMC announced on October 11, 2019, that it was adding reserves through purchases of Treasury bills through term and overnight repo operations.
This market stress episode highlights an important consideration related to the Fed's new monetary framework: Although there are currently ample reserves, there is some lower level of reserves that can cause stress in financial markets. So as the Fed continues with QT-II, it will need to evaluate when to slow and stop redemptions to avoid draining too many reserves from the banking system and cause undo financial stress. To try to evaluate the optimal amount of additional QT, one should look at the key players and institutions the Fed interacts with and how they affect the level of reserve balances in the banking system.
Today, there are three distinct domestic Fed counterparties that affect the level of reserve balances: banks, non-banks, and the US Treasury. Because each entity faces different market, regulatory, and policy constraints, each independently helps distribute system liquidity given the Fed's chosen aggregate liquidity level.
Banks demand reserves to meet internal and regulatory liquidity constraints. These demands change over time as the financial system expands and regulations change. Understanding banks' needs is important to ensure the Fed does not drain too many reserves as it continues QT.
Non-banks interact with the Fed through their overnight reverse repurchase (or repo; ON RRP) balances. Many large non-bank institutions (e.g., government-sponsored enterprises and money market funds) have access to the Fed's ON RRP facility where they can deposit funds to earn the RRP offering rate. Including non-banks as Fed counterparties was necessary because they are now a larger part of the financial system than banks. This meant a shift in Fed liabilities from bank reserve balances to the ON RRP facility. Take-up at the facility drains reserve balances, as seen in Figure 2. The Fed's ON RRP facility increased from roughly zero in the spring of 2021 to $2.55 trillion at the end of December 2022 due to year-end effects, and 2.37 trillion by the end of March 2023. The Fed has to watch how take-up at the facility will evolve, as a quick shift into (out of) the facility could drain (boost) reserve balances.

The Treasury can have a large impact on the Fed's balance sheet, as history shows. During the 2023 debt ceiling impasses, the Treasury General Account (TGA) sharply declined, from $296 billion in late April to $48 billion by the end of May. When the TGA declines, reserve balances tend to increase. During the 2023 debt ceiling impasse, reserve balances increased by $173 billion and ON RRP take-up declined by $70 billion. With the resolution of the debt ceiling impasse in June, the Treasury began issuing debt again and the TGA balance was rebuilt to $432 billion by August 14, 2023. Meanwhile, reserve balances as well as the ON RRP facility take-up fell by $86 and $455 billion, respectively. As money market mutual funds buy US Treasury bills that are now yielding more than the ON RRP offer rate, non-banks' funds are migrating from the facility to Treasuries (Figure 2).
Finally, the Fed itself can take actions that affect the level of reserve balances. The banking turmoil in March 2023, when there were sudden runs on bank deposits triggered by the (eventual) failure of three relatively large US commercial banks, resulted in the Federal Reserve establishing the Bank Term Funding Program. This program, together with the Discount Window, triggered a temporary surge in bank reserves and liquidity in general, as the Fed balance sheet temporarily increased (Figure 1). These actions were seen as efforts to bolster financial stability, as we were facing contagion at the time. As the banking turmoil subsided, and the additional use of the liquidity facilities stabilized at lower levels, QT actions dominated the Fed's balance sheet so that reductions in total assets resumed at its previous pace (Figure 1).
So where do things stand? On August 14, 2023, the Fed balance sheet was at $8.19 trillion (about 30% of GDP), bank reserve balances were at $3.22 trillion (about 12% of GDP), and ON RRP facility take-up was at $1.79 trillion (about 7% of GDP). As QT-II continues at an accelerated pace, the Fed is likely to reassess the optimal level of reserves in the near future. In the Senior Financial Officer Survey from May 2023, 78% of total respondents reported that their bank prefers to hold additional reserves above their lowest comfortable level of reserves (LCLOR), with 35% preferring to hold additional reserves of at least 50% above their LCLOR. Moreover, roughly three-quarters of respondents reported that their bank does not allow reserves to fluctuate below its LCLOR.
Earlier this year, Governor Christopher Waller suggested that ON RRP balances could drop to zero without impairing market liquidity. If this is the case, the Fed can continue QT for some time without draining reserves too low. However, there is a risk that ON RRP balances remain sizable and bank reserves represent the majority of the contraction of Fed liabilities as QT continues. In this case, regulatory banking constraints could start binding sooner than expected. Since late March 2023, the ON RRP take-up has declined by $576 billion; however, the planned issuance of Treasury bills alone may not be enough to fully deplete the facility in the second half of 2023.
What financial stability concerns should the Fed consider as it continues its balance sheet normalization plans? In QT-I, roughly $1.5 trillion in bank reserves appeared to be the limit and lower levels led money market rates to spike. This lower level amounted to about 7% of nominal GDP. At today's level of GDP, this lower limit would be $1.9 trillion in reserves. Thus, something closer to $2 trillion could be the optimal level of reserves in the system before liquidity constraints begin to force money market rates higher. The optimal level could be even higher, though. Financial markets keep evolving and desired liquidity may be something closer to 10% to 12% of nominal GDP ($2.7 trillion to $3.3 trillion), with the current level of reserve balances already around the upper bound of the estimate. However, in the July 2023 Primary Dealer Survey published by the Federal Reserve Bank of New York, the median respondent believes that reserve balances will fall to $2.625 trillion by mid-2024.
Reference
Dawsey, Kristopher, William B. English, and Brian Sack. "The Federal Reserve Balance Sheet," in Research Handbook of Financial Markets, Refet S. Gurkaynak and Jonathan H. Wright, eds., Edward Elgar, 2023, pp. 6-32.
© 2023, Federal Reserve Bank of St. Louis. The views expressed are those of the author(s) and do not necessarily reflect official positions of the Federal Reserve Bank of St. Louis or the Federal Reserve System.