
Statistics on Federal Reserve System Employment, 1915 to 2022
This essay provides statistics on the number of people employed by the Federal Reserve System over its history and a very brief overview of the forces that have shaped those employment trends.
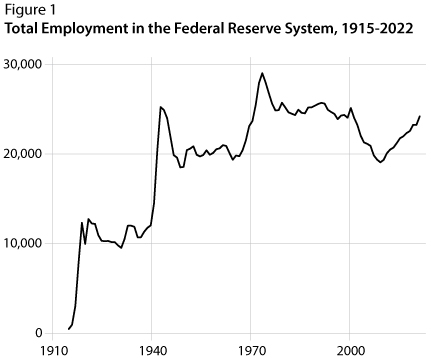

The Federal Reserve Act was enacted in December 1913, and employment data for the Board of Governors and the 12 Federal Reserve Banks are available starting in 1915. Figure 1 shows total employment in the Fed System over time, and Figure 2 breaks down employment at the Board and each of the Reserve Banks.1
The data show two peaks in employment. The first came during World War II. This peak was driven by employment in fiscal agency services—check processing for the US government and the issuance, redemption, and exchange of US government debt—especially at Reserve Banks with large money center banks in their Districts. The second peak came in the mid-1970s, amid a fast-growing volume of commercial checks cleared for banks. At that time, the breakdown of employment at Reserve Banks by function was the following2:
- Check processing: 29%
- Currency handling: 10%
- Fiscal agency services: 9%
- Bank supervision: 4%
- Other operations, including monetary and economic policy: 5%
- Administration and support: 43%
Total Fed System employment declined substantially by the 2000s, driven by declining check volumes and greater efficiency in operations. By 2011, for example, operational services, including check processing, currency handling, and fiscal agency services, had fallen to 26% of total employment at Reserve Banks. At the same time, supervision and regulation had risen to 19% of total Reserve Bank employment.3 Employment in supervision and regulation increased further after the 2008 financial crisis.
This brief overview points to a set of deeper factors that shaped employment in the Federal Reserve System over time, including the demand for services from the Fed, its efficiency and productivity in providing those services, and the Fed's responses to major economic events and legislative mandates. For example, the number of checks handled per check processing employee was about 1.4 million in 1974 compared with over 10.6 million in 2009.4 This efficiency resulted from centralization of check handling, automation, and electronic check collection. Legislation also shaped these trends. The 1980 Monetary Control Act, for example, required the Fed to recoup its costs by charging for services, such as check clearing, that it provides to financial institutions. This act added to the drive for efficiency and encouraged competition with private-sector alternatives. The Check 21 Act allowed for greater use of electronic check images, further increasing efficiency.
Readers interested in further analyzing these data can download them from this page.
Notes
1 In recent years the Reserve Banks have pooled certain centralized functions (information technology and benefits), so that some employees are not categorized as working for a Reserve Bank but rather of the centralized function.
2 Board of Governors of the Federal Reserve System, Annual Report, 1975 p. 380.
3 Board of Governors of the Federal Reserve System, Annual Report: Budget Review, 2012, p. 41.
4 The number of checks handled in 1974 was 10.82 billion and the number of employees in check handling was 7,500. The number of checks handled in 2009 was 8.85 billion, and the number of employees in "fee-based services to financial institutions" was 837.
Sources
Most data are from the Board of Governors, Annual Report, 1915-2022. Data on employment at the Board of Governors from 2009 to 2018 are estimated and interpolated from the only available data on employment in those years, the authorized number of positions (some of which may be unfilled).
Data on employment at the Board of Governors from 1925 to 2008 (with some missing) are from the Statistical Abstract of the United States. The Statistical Abstract in turn sourced these data from the annual or monthly reports of the Civil Service Commission and its successor, the Office of Personnel Management. We use data from those reports to fill in the missing years (1925, 1939-1941, 1987-1989, 1991-1992).
© 2023, Federal Reserve Bank of St. Louis. The views expressed are those of the author(s) and do not necessarily reflect official positions of the Federal Reserve Bank of St. Louis or the Federal Reserve System.