
Mortality and Economic Growth
This essay explores the relationship between economic growth and the evolution of mortality across countries between 1960 and 2019. The data are from the World Bank's World Development Indicators and Health Nutrition and Population Statistics; they are for a group of 86 countries for which there exist annual data on real gross domestic product (GDP) per capita and two measures of mortality—the crude death rate and life expectancy at birth.1
I excluded China from the sample as its demography during this period is abnormal for at least two reasons. First, during the Great Leap Forward (1958-62) and the ensuing famine, China's mortality increased by 150% in a span of a few years.2 Second, the one-child policy is largely documented to have had negative consequences on births, the male-to-female ratio, and infant mortality—particularly that of girls.3 The sample, excluding China, covers 74% of the population, 78% of deaths, and 79% of GDP in 1960. In 2019, these numbers are 78%, 76%, and 81%, respectively.
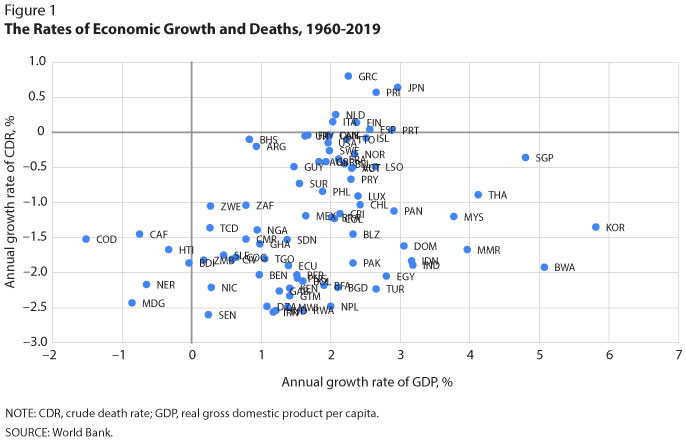
In Figure 1, the horizontal axis indicates the annual growth rate of GDP between 1960 and 2019. Most growth rates are positive because most—but not all—countries experienced economic growth during this period. The following six countries experienced a reduction in their GDP between 1960 and 2019: Burundi, the Central African Republic, Congo (Kinshasa), Haiti, Madagascar, and Niger. The vertical axis measures annual growth of the crude death rate (CDR). Most countries experienced a negative change; that is, their CDR was lower in 2019 than in 1960. The following observations can be made about this figure:
- Most countries had an increasing GDP and a decreasing CDR: lower-right quadrant, 86% of the world population in 1960.
- The six countries that had a decreasing GDP also had a decreasing CDR: lower-left quadrant, 2% of the world population in 1960.
- Finland, Greece, Italy, Japan, the Netherlands, Portugal, Puerto Rico, and Spain had both an increasing GDP and an increasing CDR: upper-right quadrant, 12% of the world population in 1960.
- No countries had a decreasing GDP and a simultaneously increasing CDR: upper-left quadrant.
- The correlation between the growth of CDR and GDP is 0.31 (not indicated in Figure 1). Thus, countries with higher economic growth had, on average, higher CDR growth; that is, their CDR tended to decrease slowly compared with countries with lower economic growth.
Put together, observations (1)-(5) are somewhat surprising because they appear at odds with the (possibly widely held) notion that economic prosperity is a first-order determinant of low mortality.4 If that were the case, wouldn't faster increases in economic prosperity (i.e., high GDP growth rates) be associated with faster decreases in mortality (i.e., low CDR growth)? But what of points (2) and (3) above, then? Countries with decreasing prosperity should have experienced increasing mortality, but they did not [point (2)]; and countries with increasing mortality should have exhibited decreasing prosperity, but they did not [point (3)]. Finally, the overall correlation between GDP and CDR growth should have been negative instead of positive [point (5)].
I discuss possible reasons for the disconnect between mortality and income in a June 2022 Regional Economist article. In a nutshell, there exist practices that can reduce mortality from diseases—by reducing either the risk of being sick or the risk of death once sick—and can be both cheap and learned quickly from observation. These include personal hygiene, household cleanliness, safe food handling, breastfeeding practices, safe sexual behavior, and the understanding of vaccines, among other practices.
For instance, oral rehydration therapy (drinking water mixed with salt and sugar) prevents dehydration from diarrheal disease, a leading cause of child mortality in the world.5 Oral rehydration therapy is cheap and can be administered without doctors or nurses present. It is possible, therefore, that countries in the lower-left quadrant experienced decreasing CDRs despite their poor economic performances because they adopted such practices over time.
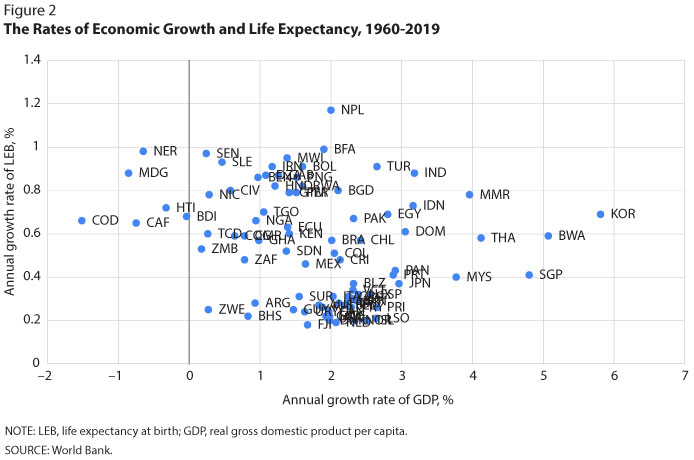
Figure 2 presents complementary information on the relationship between mortality and economic growth. The horizontal axis measures the growth rate of GDP as in Figure 1. The vertical axis measures the growth rate of life expectancy at birth (LEB) between 1960 and 2019 for each country. The following two points are worth making:
- LEB increased for all countries in the sample, including those with increasing CDR. How is this possible? Recall that the CDR is the number of deaths per population. Thus, it can vary for reasons unrelated to individuals' risk of death. When births decrease, for example, the proportion of elderly people eventually increases, leading to a higher CDR even though the risk of death for an elderly person may not have changed.
- The correlation between the growth of CDR and LEB is –0.25 (not indicated in Figure 2). Thus, countries with higher economic growth had, on average, lower LEB growth rates. This confirms the point made earlier: Faster increases in economic prosperity do not imply faster decreases in mortality, which, in the case of Figure 2, would have meant faster increases in LEB.
In conclusion, the notion that mortality is determined largely by economic prosperity is not a good description of the world after 1960: Reductions in mortality, measured by either decreasing CDR or increasing LEB, are not easily explained as resulting from economic growth.
Notes
1 The crude death rate (CDR) is the number of deaths per population in a given year. Life expectancy at birth (LEB) is the expected years of life for a newborn.
2 World Bank.
3 See https://www.medrxiv.org/content/10.1101/2022.03.09.22272156v1.
4 It is possible that people in high-income countries have access to better medical care while living unhealthy (e.g., sedentary) lives. If the second effect dominated the first, observations (1)-(5) would not be surprising. It would become difficult, however, to make sense of the mortality reduction experienced by the world at large, since 1800 at least, as it grew richer.
5 See https://www.who.int/news-room/fact-sheets/detail/diarrhoeal-disease.
© 2022, Federal Reserve Bank of St. Louis. The views expressed are those of the author(s) and do not necessarily reflect official positions of the Federal Reserve Bank of St. Louis or the Federal Reserve System.