
Can Population Aging Explain Rising Healthcare Spending Across Countries?
As countries develop, they spend a higher fraction of their resources on healthcare.1 This can be seen by looking at healthcare spending as a percentage of economic output and per capita economic output adjusted for purchasing power parity—a measure of economic development.

Figure 1 shows the relationship between healthcare spending as a percentage of gross domestic product (GDP) and economic development of a country, measured by GDP per capita for the year 2019. The x-axis plots output per capita. Because of the large differences in output per capita, it is plotted in logs. Each dot in the figure represents a country in 2019, and the red solid line represents the line of best fit. The fit suggests that a low-income country—such as Zambia, with an economic output of $3.5K per capita—spends 5.3% of its output on healthcare, while a country more than 10 times as big in terms of economic output—such as Israel, with an economic output of $45K per capita—spends about 7.5% of its output on healthcare.
Various explanations have been proposed for this rise in the share of healthcare spending as a country develops. Newhouse (1992) argued that the invention of new and expensive medical technologies causes healthcare spending to rise over time. Hall and Jones (2007) argued that healthcare is a superior good, with a greater share of resources spent on healthcare as a country develops. This essay focuses on a complementary and somewhat related mechanism: population aging.
Healthcare spending increases as people age: The elderly spend a much larger fraction of their income and wealth on healthcare (DeNardi, French, and Jones, 2010). Two related phenomena take place as countries develop: a) Life expectancy goes up—that is, people start living longer2; and b) the population ages—likely as a result of lower fertility rates and higher life expectancy—increasing the ratio of people 65 years of age or older to the total number of working-age people.
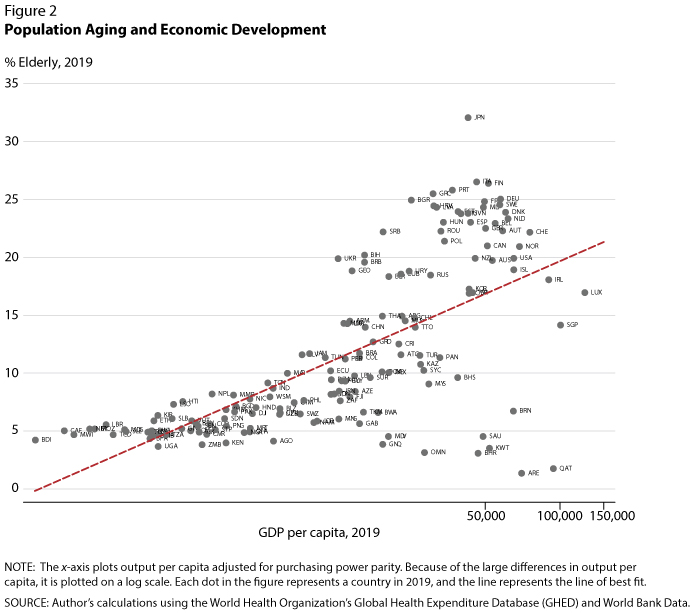
Figure 2 plots output per capita against the elderly population (i.e., those 65 years of age or older) as a percentage of the whole population excluding children younger than 15 years of age. The x-axis plots output per capita. Because of the large differences in output per capita, it is plotted on a log scale. Each dot in the figure represents a country in 2019, and the line represents the line of best fit. For example, Uganda had an elderly population of 3.7% in 2019, meaning that among every 1,000 people 15 years of age or older, there were only 37 people who were 65 years of age or older. In contrast, Japan had more than 320 elderly dependents for every 1,000 people 15 years of age or older.
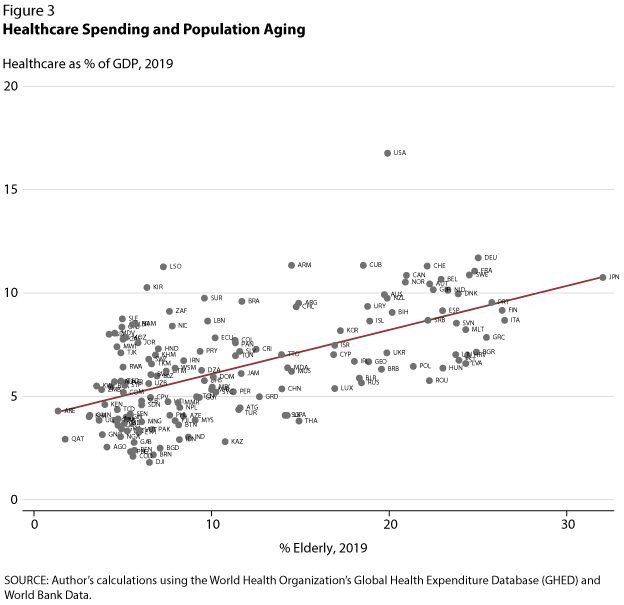
Figure 3 describes the relationship between healthcare spending as a percentage of GDP and the percentage of people 65 years of age or older. Along the x-axis, from countries with a lower percentage of elderly to those with a higher percentage of elderly, healthcare as a percentage of GDP goes up; for example, it is 4% in Uganda but 11% in Japan.
To isolate the effects of economic development and population aging on a rising healthcare share, I take out the effect of aging: Figure 1 plots the raw fit (red solid line) and the fit after controlling for population aging (blue dotted line).3 The results suggest that while there is a strong and significant positive association between healthcare spending as a fraction of GDP and economic development, once one considers the effect of population aging, the healthcare share of GDP remains stable across economic development.
Rising healthcare spending over time is an important and robust phenomenon that has huge consequences for a country's fiscal policies, labor supply, and retirement policies. Two predominant stories explored in the literature are the role of costly healthcare technologies and healthcare as a superior good. Revisiting the question using 2019 cross-country data suggests that population aging could explain some of the aggregate trend.
Notes
1 The author thanks V. V. Chari for helpful discussion leading to this article.
2 For the evolution of U.S. life expectancy over the past century, see Sanghi S. and Smaldone, A. "The Evolution of the Racial Gap in U.S. Life Expectancy." Federal Reserve Bank of St. Louis On The Economy Blog, January 27, 2022; https://www.stlouisfed.org/on-the-economy/2022/january/evolution-racial-gap-us-life-expectancy.
3 Controlling for one independent variable—in this case, population aging—allows us to isolate the effect of the other independent variable—output per capita.
© 2022, Federal Reserve Bank of St. Louis. The views expressed are those of the author(s) and do not necessarily reflect official positions of the Federal Reserve Bank of St. Louis or the Federal Reserve System.