
City Segregation and the College Degree Gap
The underlying causes of racial segregation across neighborhoods are multifold: Historical discrimination in the real estate market, redlining, and racial covenants all contributed to the establishment of segregated neighborhoods for Black and White families across the U.S. Some of those factors have since disappeared, but the segregation across neighborhoods within different cities has not.
Many researchers have found that this segregation is not innocuous; it has a negative impact on a range of outcomes for Black children (Cutler and Glaeser, 1997; Ananat, 2011). This essay examines the relationship between a city's segregation level and the gap in college attainment between Black and White children in those cities.
The data for this essay come from two sources: the 2000 Census and the commuting zone dataset of child outcomes from Opportunity Insights. The census data record the population of different races in each census tract, which is a subdivision of a county with a population averaging about 4,000 people.1 The dataset of outcomes by commuting zone—a geographic area designed to reflect the part of a local economy where people live and work—records the average level of degree attainment by race for the area.
We use a dissimilarity index as a measure of segregation. To measure dissimilarity between neighborhoods in a city, we first calculate the share of the city's Black population and the share of the city's non-Black population that live in each census tract. We use commuting zones as our definition of an overall city. Then, we take the absolute value of the difference between the Black share and the non-Black share living in that tract. Finally, we sum over all of the census tracts in the commuting zone and multiply by one half to create a measure of dissimilarity between 0 and 1.
For example, in a hypothetical commuting zone with two census tracts, if the Black population lived in one census tract and the non-Black population lived in another, then the dissimilarity index would give a measure of 1. If, in that same two-tract city, the Black and non-Black populations were divided evenly between the two tracts, the dissimilarity index would be equal to 0.

The table shows the five most dissimilar and five least dissimilar cities in the U.S., as well as their dissimilarity scores. Detroit, MI, is the most segregated city in the country by this measure. Its dissimilarity score of 0.82 means that 82% of Blacks would have to move for the racial composition of each census tract to reflect the racial composition of Detroit as a whole.
We use data from Opportunity Insights to measure the racial gap in college attainment. This dataset combines tax information with educational attainment from the 2000 U.S. Census and the 2005-15 American Community Survey. We compute the probability of obtaining a college degree for a child who grew up in a given commuting zone for the cohort born between 1978 and 1983. If one looks instead at the educational outcomes of adults who currently live in a city, the measure would be biased by migration. Looking at educational attainment based on where a child grew up tells us how exposed they were to segregation in their childhood.
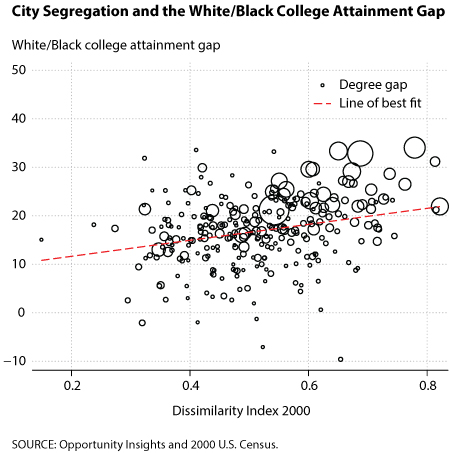
The figure displays a scatterplot of the dissimilarity index scores for 2000 and the gap in average college degree attainment between Black and White individuals for each commuting zone, with the size of each dot corresponding to the population of that commuting zone. The red line indicates a line of best fit through the points.
The figure shows a positive relationship between segregation and the gap between Black and White children in their level of degree attainment; that is, as segregation increases, so does the disparity in White and Black students getting college degrees. By choosing to use the segregation score in 2000 and the child's highest level of degree attainment in 2015, we show the level of segregation a child is exposed to while making their educational decisions. For a 0.1 increase in the dissimilarity index, the average gap in college attainment increases by 1.64 percentage points. For example, if Detroit, MI, had the same dissimilarity index as South Boston, MA, the predicted college gap would decrease by 11.02 percentage points.
The correlation we find between segregation and the college attainment gap is consistent with evidence from the literature. Cutler and Glaeser (1997) show that decreasing segregation increases the rate at which Black children get college degrees. Other articles, such as Card and Rothstein (2007), show that decreasing segregation improves other educational outcomes such as test scores. Ananat (2011) uses the layout of train tracks to establish a causal link between segregation and the Black-White income gap.
In this essay, we have used new data to expand on this previous work and create city-level measures of segregation and the racial college gap. A number of mechanisms could lead to the link between segregation and the education gap. Cutler and Glaeser (1997) hypothesize that segregation leads to differences in exposure to college-educated adults, while others suggest differences in access to high-quality schools.
Segregation mechanisms such as redlining are no longer part of the legal framework of U.S. cities, but the legacy of that segregation continues to affect children. These findings suggest that renewed efforts to integrate schools and neighborhoods could help to close the racial education gap.
Note
1 Definition from U.S. Census Bureau: https://www2.census.gov/geo/pdfs/education/CensusTracts.pdf.
© 2022, Federal Reserve Bank of St. Louis. The views expressed are those of the author(s) and do not necessarily reflect official positions of the Federal Reserve Bank of St. Louis or the Federal Reserve System.