
School District Expenditures and Race
The racial gap in educational achievement remains a key concern for policymakers. Efforts such as the No Child Left Behind Act and the Every Student Succeeds Act attempted to address this gap by targeting new policies and funds toward low-income and underperforming schools. In this essay, we examine the relationship between a school district's expenditures and revenue per student and the percent of its student body that is Black.
The data for this article come from the National Center for Education Statistics (NCES) Local Education Agency Universe Survey. We use information on regular local school districts that cover grades pre-kindergarten or kindergarten to 12th grade in the 2017-18 school year. Some school districts have abnormally high or abnormally low expenditures per student, so the bottom 1% of expenditures per student and the top 1% of expenditures per student are excluded. We also drop the 1% of districts with the smallest numbers of students.
Average Expenditures by Race
Figure 1 shows the expenditures per student for the average Black student and the average White student. Overall, spending is remarkably similar for Black and White students despite large racial differences in geography and income. The average Black student attends a district that spends $14,385 per student, while the average White student attends a district that spends $14,263 per student. If we look at current expenditures on instruction instead of total expenditures, the finding is similar, with expenditures of $7,169 vs. $7,329 for Black and White students, respectively.
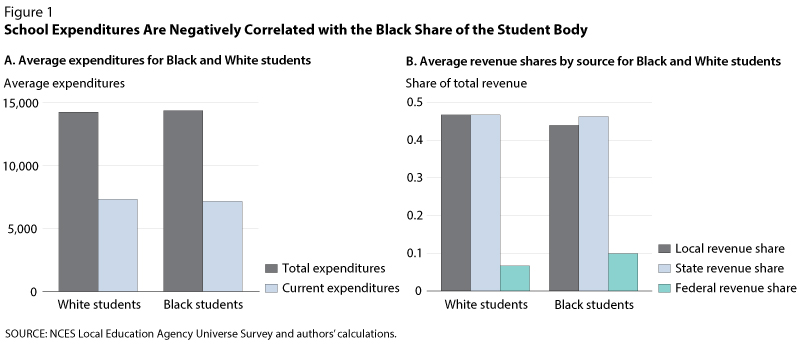
However, when examining sources of funding, the racial gaps are starker. The average White student attends a district where 47% of funding is from local sources and 7% is from federal sources. In contrast, the average Black student attends a district where 44% of funding is from local sources and 10% is from federal sources. The share of funding from state sources is very similar at 46%. Because federal funding often comes as grants or for specific programs, school districts that serve predominantly Black student bodies may have less control over how these funds are spent.
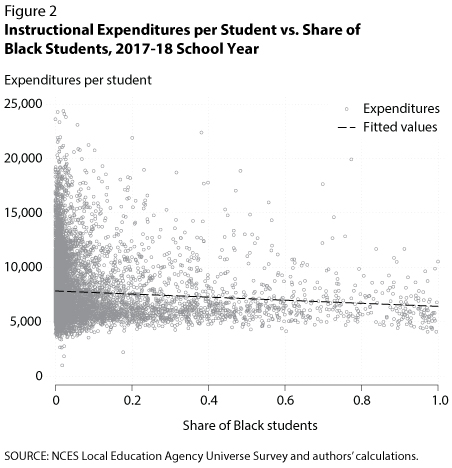
However, when we look at the relationship between expenditures per student and the share of a district's student body that is Black, the data tell a slightly different story. Figure 2 shows the relationship between the expenditures on current instruction per student and the share of the student body that is Black. There is a small but statistically significant negative relationship; on average, schools with a 10-percentage-point higher share of Black students spend $140 less per student on instruction. The data on total expenditures are similar; schools with a 10% higher share of Black students spend $160 less per student.
How can we reconcile this negative correlation with the fact that, on average, expenditures per student are very similar for Black and White students? Looking at the scatter plot, one can see there is a lot of variation in school spending, from a minimum of around $1,000 to almost $25,000 per student. It is also clear that the districts spending the most tend to have a mostly White student body. The negative relationship between expenditures per student and the Black share of the student body is largely driven by these small and predominantly White districts that do not educate a large number of students nationwide.
Conclusion
Despite many efforts by policymakers, there remains a large racial gap in key educational outcomes such as high school graduation rates and college attainment.1 In this essay, we examine whether school expenditures differ by race. Average expenditures are very similar for the average Black and average White student, though sources of funding differ, with Black students receiving more federal funds and White students more local funds. Despite this, there is still a negative correlation between expenditures and the share of students who are Black. This outcome is driven by small, predominantly White schools with high expenditures that do not educate a large share of the student body nationally.
Notes
1 See the following: American Council on Education. "Educational Attainment, by Race and Ethnicity." https://www.equityinhighered.org/indicators/u-s-population-trends-and-educational-attainment/educational-attainment-by-race-and-ethnicity/, accessed February 8, 2022.
© 2022, Federal Reserve Bank of St. Louis. The views expressed are those of the author(s) and do not necessarily reflect official positions of the Federal Reserve Bank of St. Louis or the Federal Reserve System.