
Inflation and Shipping Costs
Since March 2020, the price of shipping goods by sea has increased substantially. Along with price increases, disruptions and high volumes at ports have led to ships sitting idle and delays in unloading cargo.1 In a January 2022 tour of the Port of Long Beach, Transportation Secretary Pete Buttigieg discussed the influence of these disruptions on inflation, stating, "There's no question that when you have a scarcity of access to shipping, you're going to see upward pressure on prices, and that's going to be part of our challenge when it comes to inflation."2
Maritime shipping represents a key piece of the U.S. supply chain, as well as a major way goods reach the United States; 57% of the total value of the average imported good arrives by sea.3 The spike in maritime freight prices aligns with the large spike in import prices, pointing toward increased maritime freight costs as a potential explanation for recent import price inflation.
In this essay, we examine the claim that the increase in shipping prices has been a factor in the recent rise in inflation. In particular, we look at whether the price of imports has increased more for products that tend to be imported by sea or for those imported by other methods, such as air or rail.
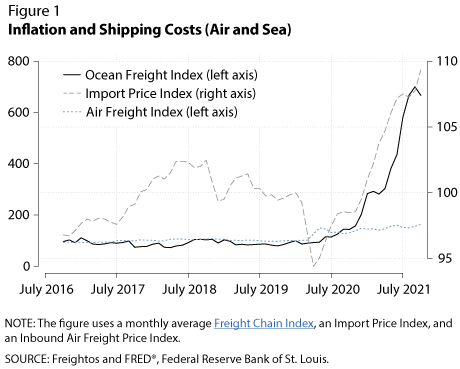
Figure 1 shows the price indexes of freight by air and sea, as well as the overall price index for all imported goods. The indexes are normalized so that their values in January 2020 equal 100. Import prices are up about 10% since the start of the pandemic, while total shipping costs are up more than 600%. The price of air freight has also risen during the pandemic; however, this price increase is not nearly as extreme, having risen only 50% compared with 600% for ocean freight.
To explore this relationship further, we use data on import price inflation for different goods combined with data on how each good arrives in the United States. The data on transportation types come from the United Nations Conference on Trade and Development (UNCTAD), World Bank, and Equitable Maritime Consulting for 2016, which provide the different quantities of goods shipped by different methods of transportation. Their information covers shipping by air, sea, rail, land, and non-standard forms of transit. The Bureau of Labor Statistics (BLS) creates data on import prices for a wide variety of goods coming into the United States, including consumer items such as furniture and apparel; food items such as meats, fruits, and vegetables; and commodities such as plastic. We drop oil and petroleum products from the sample.
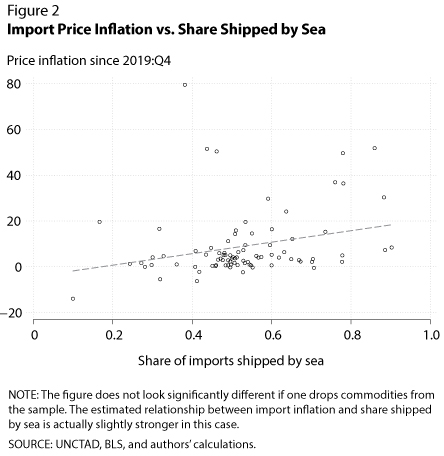
Figure 2 compares the change in prices for each import type with the share of imports shipped by sea, which we measure as the amount of goods transported by sea divided by the total imports of that good. The value for the share shipped by sea comes from 2016, so it is unaffected by any changes in shipping behavior due to the pandemic. To measure price changes since the beginning of the pandemic, we calculate the growth in import prices between 2019:Q4 and 2021:Q4.
Each black dot in Figure 2 represents one category of imports. For instance, 40% of insulated conductors are imported by boat, and this good has seen a 7% increase in prices since 2019:Q4. On the other hand, 76% of coffee is shipped by sea, and this good has seen 37% inflation in that same period—well over the inflation rate for the average good.
The graph shows the scatterplot and the line of best fit through the points. The upward slope of the line indicates that a greater share of imports transported by boat in 2016 has meant a larger change in prices since the beginning of the pandemic. On average, import inflation has been 2.5 percentage points higher for goods that are already 10 percentage points more reliant on ocean freight. Some commodities, such as aluminum, have seen large changes in prices without having a large maritime share of imports. However, the graph shows that, on average, having a larger share of maritime imports has meant larger price increases throughout the pandemic. Statistical tests indicate that this relationship is unlikely to have occurred by chance.
Pandemic disruptions combined with high demand for imported goods has led to unprecedented costs for shipping goods by sea. This has led many, including UNCTAD and industry experts,4 to speculate that the price of shipping is responsible for the recent increase in import price inflation. Though we cannot say for sure that shipping prices have caused higher import prices, we find evidence to support this hypothesis: Imports that are more reliant on ocean freight have also seen higher import price inflation. Research suggests that the increase in import prices will pass through to consumer and producer prices.5 Thus, the increase in maritime shipping costs is likely increasing prices for everyone.
Notes
1 See the following: Insider article on delays in the Port of Long Beach; Journal of Commerce article on the rising number of ships waiting at the Port of New York–New Jersey, even as freight is diverted to other ports; and NPR Planet Money podcast about the Port of Los Angeles, describing the evolution of freight structure and why there has been a greater amount of larger freight.
2 See "Supply Chain Snags Continued to Drive Up Inflation in December." New York Times.
3 This number is from author calculations using the UNCTAD data discussed in this essay.
4 See "Surging Shipping Costs Will Drive Up Prices for Some Consumer Products by 10%, New U.N. Report Finds." CNBC World Economy; and "Surge in Shipping Costs Globally Could Cause Price Hikes From Coffee to Toys." Time.
5 Amiti, M.; Heise, S. and Wang, A. "High Import Prices along the Global Supply Chain Feed Through to U.S. Domestic Prices." Federal Reserve Bank of New York Liberty Street Economics, November 2021; https://libertystreeteconomics.newyorkfed.org/2021/11/high-import-prices-along-the-global-supply-chain-feed-through-to-u-s-domestic-prices/.
© 2022, Federal Reserve Bank of St. Louis. The views expressed are those of the author(s) and do not necessarily reflect official positions of the Federal Reserve Bank of St. Louis or the Federal Reserve System.