
International Trade and the Dynamics of Manufacturing Activity
The U.S. economy has recently been exposed to shocks that could reduce economic activity. First, the ongoing slowdown of economic activity in the world economy may reduce foreign demand for goods produced in the United States. Second, increased uncertainty about U.S. trade policy and its potential impact on foreign trade policy may reduce investment and economic activity in sectors with business models that depend on international trade. Indeed, these two considerations have recently motivated the Federal Reserve's Federal Open Market Committee to ease monetary policy.1
In this essay, we investigate the extent to which international trade considerations might impact the manufacturing sector. We first examine an index that tracks the evolution of new export orders of manufactures over recent months. We then investigate the extent to which fluctuations of this index are likely to be associated with fluctuations of U.S. manufacturing output and employment.
New Export Orders
For this study, we use the Institute for Supply Management (ISM®) Manufacturing New Export Order Index. It is based on a survey of firms and measures the overall direction of changes in new export orders across firms. Declines in this index indicate that more surveyed firms report declining export orders. The index declined by 27 percent between September 2018 and September 2019, indicating that more firms are experiencing declines in new export orders. This sudden decline in export orders of manufactures suggests that manufacturing exports and production might decline in the near future.
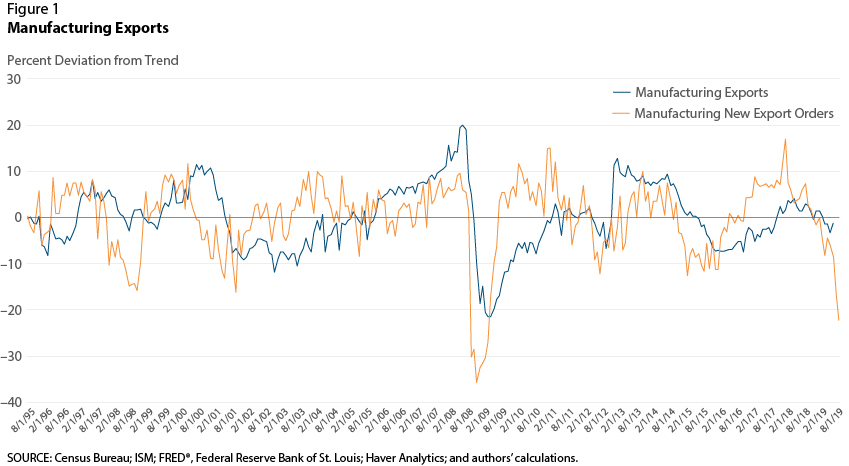
To place these recent changes in historical context, Figure 1 plots the percentage deviations from trend of the ISM Manufacturing New Export Order Index (orange line).2 The recent decline in the index represents the second-largest decline of this measure since 1995, with the only larger decline occurring in December 2008 during the Great Recession.
If new export orders are declining today, when should we expect manufacturing exports to start declining? To answer this question, Figure 1 also plots the deviations from trend of manufacturing exports through July 2019 as measured by the U.S. Census Bureau (blue line): These exports began to slow down in early 2019, and then started to contract in July, but the series has not been updated more recently to compare with the latest changes in the ISM index.
The figure shows that new export orders generally lead (or predict) manufacturing exports several months into the future. For example, a big decline in export orders in October 2008 preceded the big decline in exports in early 2009. More formal statistical analysis shows that changes in new export orders today are associated with changes in manufacturing exports after three to five months. Thus, the correlation between these two series suggests that we might expect to see manufacturing exports decline significantly in the coming months.
Exports and Fluctuations of U.S. Manufacturing Output and Employment
While the latest observations suggest that manufacturing exports are slowing, to what extent might this affect manufacturing output and employment? To answer this question, we investigate the extent to which exports are systematically related to fluctuations of U.S. manufacturing output and employment. Figure 2 plots the percentage deviations from the trends of manufacturing exports, manufacturing employment, and the Industrial Production Index of manufacturing sectors.

We observe that manufacturing exports are substantially more volatile than manufacturing production and employment. Yet, they are strongly correlated: Large declines in manufacturing exports are likely to coincide with significant declines in manufacturing output and employment. Therefore, one might expect that the ongoing decline of U.S. manufacturing exports would be associated with a contemporaneous decline in U.S. manufacturing output and employment. But further research is needed to better assess this potential relationship.
Notes
1 See, for instance, Federal Reserve Chairman Jerome Powell's press conference on July 31, 2019; https://www.federalreserve.gov....
2 We detrend the data by applying the Hodrick-Prescott filter to logged monthly time series data with a smoothing parameter of 129,600 (following Ravn and Uhlig, 2002). We then plot the cyclical component to create the figures.
Reference
Ravn, Morten O. and Uhlig, Harald. "On Adjusting the Hodrick-Prescott Filter for the Frequency of Observations." Review of Economics and Statistics, May 2002, 84(2), pp. 371-76.
© 2019, Federal Reserve Bank of St. Louis. The views expressed are those of the author(s) and do not necessarily reflect official positions of the Federal Reserve Bank of St. Louis or the Federal Reserve System.