
Understanding the Trade Imbalance and Employment Decline in U.S. Manufacturing
Why Does the U.S. Always Seem to Run a Trade Deficit?
The answer to this question lies in economic development that occurred in the early 1970s. The United States—the largest and most powerful economy after World War II—abandoned the gold standard in 1971, which led to the collapse of the Bretton Woods system. As a result, the U.S. dollar became the most widely used currency worldwide and the most popular foreign reserve along with U.S. government securities. In fact, foreign holdings of U.S. Treasury securities started to increase in the early 1970s. More than 40 years later, by 2014, these holdings surpassed $6 trillion, rising from about 3 percent of total U.S. government debt in 1970 to around 30 percent in recent years.
Many countries can issue debt in their own currency. Why is the United States so different? First, it all goes back to the Bretton Woods agreement in 1944 that selected the U.S. dollar as a global reserve currency.1 The chief feature of the Bretton Woods system was the obligation of each country to adopt a monetary policy that maintained its external exchange rates by tying its currency to gold. The United States, which controlled two-thirds of the world's gold, insisted that the Bretton Woods system rest on both gold and the U.S. dollar. Second, since the collapse of the Bretton Woods system, much of international trade (such as oil) has been priced in U.S. dollars, fueling demand for the currency.
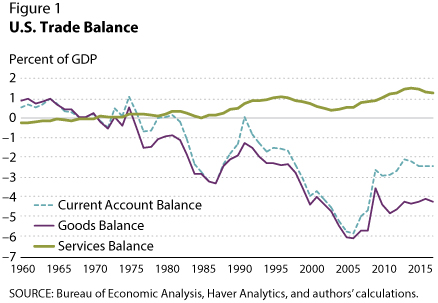
The collapse of the Bretton Woods system and the continued worldwide use of the U.S. dollar as both a medium of exchange and a store of value have given the United States the ability to purchase goods from the world market simply by printing money or issuing debt. As a result, the United States is more likely to run trade deficits. Indeed, just a few years after the Bretton Woods system ended, the U.S. trade balance started to show persistent and growing deficits—still seen today (Figure 1).
Under the national accounting identity, national savings (i.e., total output minus consumption and government spending) equals investment plus net exports. Trade deficits (negative net exports) therefore imply insufficient national saving to finance national investment. So the U.S. gap between saving and investment started to widen around the early 1970s, with the total gap (total cumulative trade deficit) rising to around $11 trillion in 2017.2 Foreign countries fund this debt by trading goods for U.S. securities, making the United States the largest debtor in the world. In other words, the United States is able to consume more goods than it produces and finance its investments by borrowing from foreign countries.
Who Are the Major U.S. Creditors?
Initially, the countries facing postwar recovery, such as Germany and Japan, were the counterparties to the U.S. trade deficits and thus the primary U.S. creditors, but that designation gradually shifted to the emerging Asian Tigers by the early 1980s. Indeed, of the total U.S. goods trade deficit, the East Asian and Pacific region alone accounted for more than 80 percent in 1991 (Figure 2).

However, the Asian contribution to the U.S. goods trade deficit has been steadily declining since 1991 and now stands at around 65 percent, despite China's rise as the largest U.S. creditor—that is, the largest holder of U.S. dollars and government securities.
In other words, the rise of China since the late 1980s and especially early 2000s after joining the World Trade Organization has not increased Asia's trade surplus with the United States, but China has replaced other Asian economies as the primary U.S. creditor. That is, even though China's share of the total U.S. goods trade deficit has been increasing rapidly, from around 15 percent in 1991 to 45 percent around 2016, it has not increased Asia's share of that deficit.
Are Trade Deficits Responsible for the Decline of U.S. Manufacturing Employment?
Agriculture was the major employment sector in all countries before the Industrial Revolution. But nowadays the sector employs less than 2 percent of the total U.S. labor force.3 This drop in employment is due to the dramatic increase in labor productivity in agriculture—fewer workers can grow the same amount of food. This productivity increase has freed up workers to move into the manufacturing sector since the mid-nineteenth century.

A similar phenomenon happened after WWII in the manufacturing sector. Figure 3 shows that labor productivity in the goods manufacturing sector rose faster than in any other sector in the United States after WWII. This rapidly rising productivity freed up manufacturing labor to move to the service sector and caused labor-intensive goods-producing firms to relocate abroad. This process inevitably reduced U.S. manufacturing employment. Indeed, using a calibrated dynamic stochastic general equilibrium model, economists Timothy Kehoe, Kim Ruhl, and Joseph Steinberg (2018) show that the rapidly rising labor productivity in the goods manufacturing sector produced 85 percent of the employment reduction in that sector, while the rising U.S. trade deficit with the rest of the world explains only the remaining 15 percent.4
Conclusion
Economic analysis suggests that a trade war with China can neither stop the decline in American manufacturing employment nor eliminate the U.S. trade deficit, but it could significantly reduce the welfare of American consumers by making U.S. imports of Chinese goods more expensive. Moreover, it could cause the United States to lose its global leadership in free trade and globalization and facilitate China's rise as a world leader in trade and commerce. A better approach may be for policymakers to design policies that can ensure fair redistribution of the gains from free trade among American citizens and to reform the education system to prepare students for future jobs that require knowledge of automation and artificial intelligence.
Notes
1 The Bretton Woods agreement decided the following: The U.S. dollar was established as an international reserve currency, the U.S. dollar was backed by gold at a price of $35 per ounce, and any country could exchange dollars for gold (see Ghizoni, 2013).
2 This idea follows from the national accounting identity that GDP is the sum of consumption, investment, government spending, and net exports. Gross savings is defined as GDP minus consumption and government spending. Then by rearranging the national accounting identity with the definition of gross savings, we can see that net exports is savings minus investment. Therefore, a nation runs a trade deficit when savings is less than investment and runs a trade surplus when savings is greater than investment.
3 See Bureau of Labor Statistics (2017).
4 See Kehoe, Ruhl, and Steinberg (2018).
References
Bureau of Labor Statistics. "Employment by Major Industry Sector." Last modified date: October 24, 2017; https://www.bls.gov/emp/ep_table_201.htm.
Ghizoni, Sandra Kollen. "Creation of the Bretton Woods System." Federal Reserve History. Written as of November 22, 2013; https://www.federalreservehistory.org/essays/bretton_woods_created.
Kehoe, Timothy J.; Ruhl, Kim J. and Steinberg, Joseph B. "Global Imbalances and Structural Change in the United States." Journal of Political Economy, 2018, 126(21).
© 2018, Federal Reserve Bank of St. Louis. The views expressed are those of the author(s) and do not necessarily reflect official positions of the Federal Reserve Bank of St. Louis or the Federal Reserve System.