
How Open to Trade Is the U.S. Economy?
Recent trade policy changes in the U.S. contrast sharply with its longtime tradition as an advocate of free trade. In particular, recent tariff increases on imports from major trade partners suggest the U.S. economy may be becoming increasingly closed to trade with the rest of the world. But how open was the U.S. economy to begin with? This essay investigates the extent to which the U.S. economy was open to international trade prior to recent changes in U.S. trade policy.
There are many different ways of measuring and evaluating whether a country is open to trade. Given the recent popularity of import tariffs as a trade policy instrument, I focus on import tariffs as an indicator of the U.S. economy's degree of openness. Thus, in this essay I examine their magnitude prior to the round of tariff increases that began in 2018.
To do so, I combine data on U.S. tariffs from the UNCTAD's TRAINS database with data on U.S. imports from the U.N.'s Comtrade database. The data are provided at a fine level of disaggregation such that tariffs and imports are observed for very detailed product categories (6-digit Harmonized System [HS] categories). I focus on effective tariffs computed for each country of origin and product category pair in the data, where effective tariffs are equal to the most-favored-nation1 tariff unless there is a lower preferential tariff. I restrict attention to the year 2016 since it is the latest year for which trade and tariff data are both available at a fine level of disaggregation.
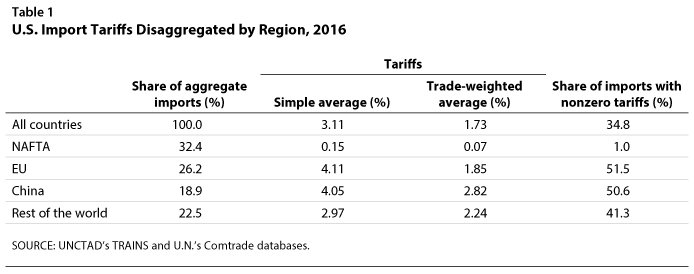
The first row of Table 1 reports summary statistics on the pattern of U.S. tariffs in the aggregate. I find that U.S. tariffs are very low on average—3.11 percent when averaging across all country of origin and product category pairs and 1.73 percent when weighting pairs by the share of aggregate imports they account for. Moreover, I find that a significant fraction of goods imported into the U.S. have no tariffs at all, accounting for 65.2 percent of aggregate imports.
The second to fifth rows of Table 1 report these same statistics, but they are disaggregated by the following regions: (i) NAFTA countries (e.g., Mexico and Canada), (ii) the European Union (EU; its 28 member countries), (iii) China, and (iv) the rest of the world. I find that tariffs on imports from NAFTA countries are lower than those on imports from the rest of the countries, with just 1 percent of imports from NAFTA countries subject to nonzero tariffs. Average tariffs are thus very low at 0.15 percent and equal to 0.07 percent on a trade-weighted basis.
In contrast, slightly more than half of total imports from the EU and China are subject to nonzero tariffs; this value is equal to 41.3 percent of imports from all other countries. Thus, average tariffs are higher than those for NAFTA countries, with their simple average equaling 4.11 percent, 4.05 percent, and 2.97 percent for EU countries, China, and the rest of the world, respectively. This is similarly the case on a trade-weighted basis.

Table 2 shows that, despite the overall low tariffs, there are certain product categories that are subject to relatively steep tariffs. To illustrate this, I compute the average import tariffs charged across 2-digit HS product categories, and I report the 10 categories with the highest average tariffs. Tobacco and tobacco-related products by far face the steepest average tariffs, equal to 32.95 percent; however, these account for a small share of aggregate imports. On the other hand, clothing-related products such as apparel, cotton, and footwear are also subject to high tariffs, in the 5 to 10 percent range, and account for a considerably higher share of aggregate imports.
Despite the observed variation by region of origin and across some specific product categories, these findings show that import tariffs in the U.S. were very low in 2016. For instance, they are significantly lower on average than the typical sales taxes prevalent in the U.S.2 So, from the lens of this particular trade policy instrument, the U.S. was a very open economy prior to the round of tariff increases that began in 2018.
It is important to emphasize that there are many other ways in which the U.S. might distort international trade flows that are not captured by import tariffs. Examples of popular non-tariff barriers abound, ranging, for instance, from requiring unnecessary bureaucratic procedures to approve import transactions to providing subsidies to domestic producers to improve their competitiveness vis-à-vis foreign firms. More work needs to be done to better quantify the impact of these non-tariff barriers on the U.S. economy's degree of openness.
Notes
1 Most-favored-nation tariffs are the tariffs charged on imports from all WTO members unless there is some bilateral trade agreement with another country that specifies lower preferential tariffs on the imports from such country of origin.
2 See, for instance, https://en.wikipedia.org/wiki/Sales_taxes_in_the_United_States.
© 2018, Federal Reserve Bank of St. Louis. The views expressed are those of the author(s) and do not necessarily reflect official positions of the Federal Reserve Bank of St. Louis or the Federal Reserve System.