
PMI and GDP: Do They Correlate for the United States? For China?
The manufacturing Purchasing Managers' Index (PMI) measures the growth of economic activity in the manufacturing sector and, indirectly, the whole economy. It is constructed from a monthly survey of private companies. The PMI is timelier than official gross domestic product (GDP) data, which are released with a longer delay. The PMI therefore is widely used to assess and forecast the economy and, hence, influences financial markets, including the stock market. But how well does the PMI correlate with the GDP growth rate?
The first figure plots the relationship between the U.S. PMI1 and GDP growth rate at a quarterly frequency since the first quarter of 2005.2 This scatterplot shows a strong positive correlation (0.75 correlation coefficient) between PMI and GDP growth, confirming results found in Koenig (2002).3 But what does the PMI level really mean?
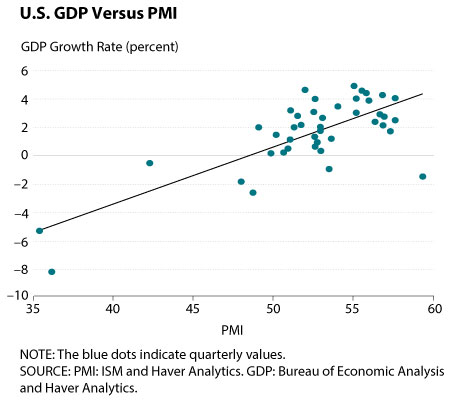
By design, the PMI is a diffusion index.4 A diffusion index greater (less) than 50 percent indicates that more (less) than half of survey respondents reported better (worse) economic conditions than they reported in the previous period. For the PMI, an index level greater than 50 percent suggests that the manufacturing sector generally expanded relative to the previous month and an index level less than 50 percent suggests it contracted. For the United States, when the PMI was above 50 percent, GDP growth was more often positive than negative.

PMIs are produced for other countries as well. The second figure plots the PMI and the GDP growth rate for China5 over the same period. China is particularly interesting because its recent economic slowdown incited concern over weak global growth, causing turmoil in most major stock markets since August 2015. China's PMI and GDP also exhibit a robustly positive relationship. The 0.73 correlation coefficient is almost identical to that for the United States. However, a PMI of 50 percent for China no longer indicates a near-zero GDP growth rate because China's growth has been so strong for the past 25 years. In fact, China's GDP still grows at around 5 percent annually even when its PMI is below 50 percent. In addition, China's GDP growth rate is more sensitive to changes in the PMI than the U.S. GDP growth rate is. For China, an increase in the PMI from 50 percent to 55 percent could increase the predicted GDP growth rate from 5 percent to more than 15 percent. For the United States, however, a similar increase in the PMI would not affect the GDP growth rate as strongly.
In sum, the PMI seems to be a good, although not perfect, indicator of a country's current economic condition. Similar PMI levels for China and the United States, however, do not indicate similar GDP growth rates. In our sample, the U.S. PMI is often higher than China's PMI, yet the U.S. GDP growth rate is lower throughout the entire sample period. This finding makes sense because the United States and China are in very different stages of development. China's GDP is not only growing faster than U.S. GDP, on average, but its growth rate is also much more volatile, resulting in a wider range of GDP growth rates corresponding to a narrower PMI range.
Notes
1 The U.S. PMI is published by the Institute for Supply Management (ISM). The ISM publishes a PMI for the nonmanufacturing sector as well.
2 The PMI is published monthly. We average the monthly PMI to report a quarterly PMI. Quarterly GDP data are used. The GDP growth rate is annualized.
3 Koenig, Evan F. "Using the Purchasing Managers' Index to Assess the Economy's Strength and the Likely Direction of Monetary Policy." Federal Reserve Bank of Dallas Economic and Financial Policy Review, 2002, 1(6); http://dallasfed.org/assets/documents/research/efpr/v01_n06_a01.pdf.
4 For information on the construction of the U.S. PMI, see ISM. "January Manufacturing ISM® Report on Business®." Press release, February 1, 2016; https://www.instituteforsupplymanagement.org/ismreport/mfgrob.cfm.
5 China's PMI is published by the China Federation of Logistics and Purchases. For information on its construction, see National Bureau of Statistics of China. "China's PMI Was 49.4 Percent in January." Press release, February 1, 2016; http://www.stats.gov.cn/english/PressRelease/201602/t20160201_1314222.html.
© 2016, Federal Reserve Bank of St. Louis. The views expressed are those of the author(s) and do not necessarily reflect official positions of the Federal Reserve Bank of St. Louis or the Federal Reserve System.