Home > Tracking the Global Recession
|
Track the Economic Indicators |
|
Track the GDP Data |
|
Business Cycles Dates |
|
|
|
PDF version of charts and data references.
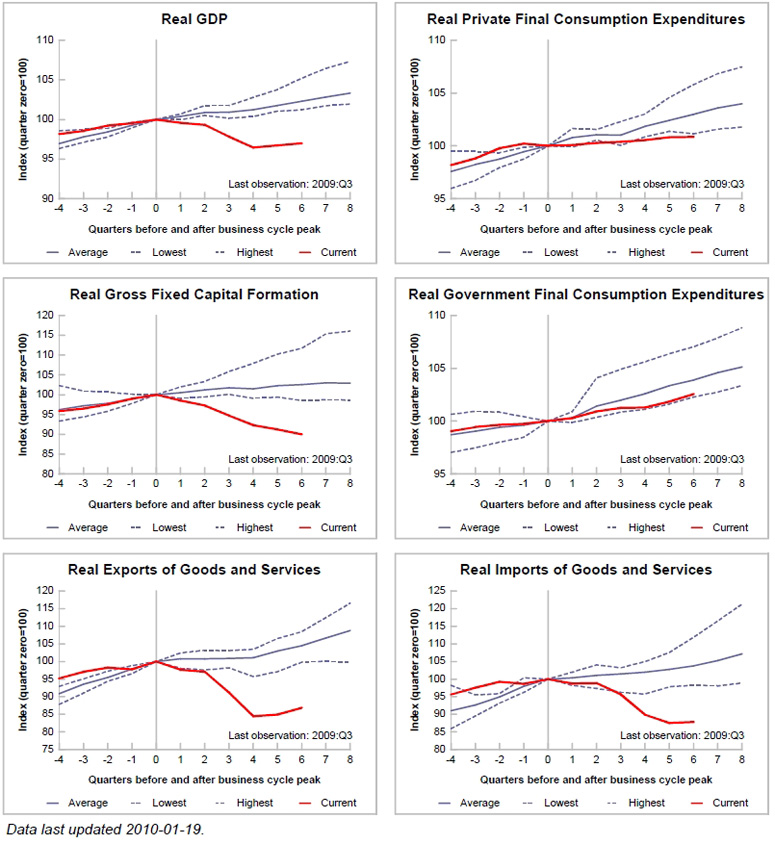
NOTE: The charts plot Real Gross Domestic Product (SA, Chained) and its major components; each series is indexed to 100 at the business cycle peak. The
red line indicates the current recession.
The solid blue line indicates the average of the previous six
recessions, starting with the August 1979 peak. The two dashed lines report the highest and lowest values recorded across these previous recessions.
|
The data and recession dates used in the charts are from the Organisation for Economic Co-Operation and Development (OECD). The following data series
are used to create the charts above:
- Real Gross Domestic Product
- Real Private Final Consumption Expenditures
- Real Gross Fixed Capital Formation
- Real Government Final Consumption Expenditures
- Real Exports of Goods & Services
- Real Imports of Goods & Services
SOURCE: Quarterly National Accounts, © Organisation for Economic Co-Operation and Development (OECD),
<http://www.oecd.org>.
|
