
Worker Diversity and Wage Growth Since 1940
Abstract
Since 1940 the average worker has become older, more educated, more likely to be a woman, less likely to be White, and slightly less likely to be single. How has this evolution of the average worker affected wage growth, that is, the wage of the average worker? We conduct two sets of experiments: First, we decompose wage growth between a "growth effect" and a "distribution effect." The former measures the effect of a change in the wage function, associating wages with worker types; the latter measures the effect of the changing distribution of worker types. Both effects contribute significantly to wage growth. Second, we evaluate the contribution of changing marginal distributions of these worker types one at a time: Aging and education enhanced wage growth, while the increased participation of women and non-White workers deterred wage growth—the latter effect being a direct implication of gender and racial wage gaps.
Makenzie Peake is a research associate and Guillaume Vandenbroucke is a research officer and economist at the Federal Reserve Bank of St. Louis. This article was originally circulated as "The Evolution of Wages Since 1940." The authors thank Alexander Monge-Naranjo for useful comments and suggestions.
Introduction
The wage rate of the typical American worker is the subject of countless discussions in the press and academic circles. Growth of the wage rate is often associated with the performance of the labor market, and when compared with inflation it is an indicator of the purchasing power of workers. In this article, we take a long-run perspective and discuss the evolution of the real U.S. wage rate since 1940.
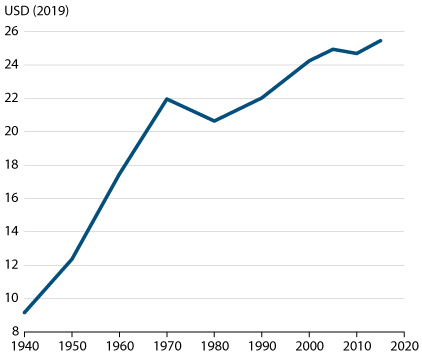
Figure 1
Average Hourly Wage Rate
SOURCE: IPUMS and authors' calculations.
Figure 1 shows the real wage rate (i.e., labor earnings per hour, or hourly wages) for the average U.S. worker from 1940 to 2015. The average growth is 1.4 percent per year during this period, but it is not constant. The average wage rate slowed down (and even declined) at the start of the 1970s, which corresponds to the so-called "productivity slowdown." It took two decades before the wage rate reached its 1970 value again. Another decline occurred between 2005 and 2010 and corresponds to the Great Recession. Figure 1 also emphasizes a long-lasting stagnation over recent decades: The wage rate more than doubled between 1940 and 1970, whereas in the 40 years after 1970 it increased by only 12 percent.
Our goal is to present a series of exercises to describe wage growth in the United States, or the lack thereof. We use the word "describe" on purpose: We do not seek to "explain" wage growth; that is, our analysis does not indicate causal factors behind changes in the real wage rate. Our motivation stems from the observation that the "average worker" paid the hourly wages represented in Figure 1 is not the same in the 2010s as the average worker in the 1980s or the 1940s. Specifically, we show the extent to which the average worker in the 2010s is older, more educated, more likely to be a woman, less likely to be White, and slightly less likely to be single than the average worker in the 1940s. Therefore, changes in the average hourly wages represented in Figure 1 reflect both changes in the hourly wages of various types of workers and changes in the type composition of workers. We quantify the contributions of these two components of wage growth.
We start with a description of the data in Section 2. We use data on the number of workers by type (i.e., by age, education, sex, race, and marital status), wage income, and hours worked. Our sources are the decennial U.S. Census and the American Community Survey. In Section 3, we present the distribution of worker types and discuss how it has changed over the years. We also present and discuss the evolution of the wage rate for each type of worker.
Our analysis and results are in Section 4. We first decompose wage growth between the contribution of the hourly wages per type and that of the distribution of types (Section 4.1). We call the former the growth effect and the latter the distribution effect. We find that both effects play a noticeable role at different points in time: The growth effect tends to be the largest component of wage growth during periods of fast economic growth, while the distribution effect is the largest component during periods of slow economic growth. The distribution effect results, in part, from slow-moving demographic trends (e.g., aging) and is, therefore, quite stable over time. We apply the same decomposition to each sex-race subgroup and discuss the growth rate of wages across these subgroups. In Section 4.2 we present a different type of exercise to assess the effects of the changing distribution of worker types along specific margins. We ask, for example, what the evolution of the wage rate would have been if the age distribution of workers had remained at its 1940 values throughout the sample period. We repeat this analysis for the effects of education, sex, race, and marital status, respectively. We find that the increasing proportion of female workers dampened wage growth because women tend to be paid less than men; thus, as the average worker has become more likely to be a woman, average wage growth has been slowing down. Similarly, we find that wage growth has been enhanced as the average worker has become older and more educated and dampened as the average worker has become less likely to be White. The fact that the average worker has become slightly less likely to be single implies slightly higher wage growth.
Our article relates to a vast literature documenting and explaining wage inequality. If there were no inequality, say if men and women were paid exactly the same wages, then the increasing proportion of working women would have no effect on the hourly wages of the average worker. The same argument can be made for age, race, and marital status. Thus, the importance of the changing distribution of worker types for wage growth emanates directly from the presence of wage inequality across these characteristics. The point of our article is to quantify these effects and argue that they are of significance. For the interested reader, see the following (far-from-exhaustive) list of papers on inequality (with references to even more papers): Ben-Porath (1967) provides a theory of wage growth over the life cycle, thereby explaining wage inequality by age. Heckman, Lochner, and Taber (1998), Huggett, Ventura, and Yaron (2006, 2011), and Guvenen and Kuruscu (2010) also use the Ben-Porath model to discuss wage inequality and the college premium. Goldin (1992) analyzes the gender wage gap in earnings. Katz and Murphy (1992), Card and Lemieux (2001), and Bowlus and Robinson (2012) discuss wage differences across education groups. Restuccia and Vandenbroucke (2013) and Daly et al. (2017) discuss wage growth and Black-White inequality in the United States.
Read the full article.