
Where Are Labor Markets the Tightest? A Tale of the 100 Largest US Cities
Introduction
The economic recovery from the COVID-19 pandemic has been characterized by a tight labor market. Economists measure labor market tightness in many ways, but one common measure is the vacancy-to-unemployment (VU) ratio. As of August 2023, the VU ratio for the United States was 1.5. In other words, there were 1.5 vacancies (aka, job openings) per unemployed person. We can compare VU ratios to see how the US labor market has changed since the pandemic: Before the pandemic in 2019, the average VU ratio was 1.2. At the height of labor market tightness in March 2022, it was 2.0.
Of course, labor market tightness varies geographically across the US. So, where is the labor market the tightest? Answering this question is hampered by data limitations. The most common measure of job openings comes from the Job Openings and Labor Turnover Survey (JOLTS), which is nationally representative and produced by the Bureau of Labor Statistics (BLS) using firm-level survey data. At its most granular, it is available at the state level, which limits inferences regarding local labor market conditions.
In this essay, we use a new dataset on job openings to examine the VU ratio across US cities.1 We document which cities have the tightest labor markets in 2023 and how their labor markets have changed since the pandemic.
The Data
We use a dataset from the firm LinkUp that collects job listings from more than 60,000 employer websites every 24 to 48 hours. LinkUp's sample of employers is primarily composed of (although not limited to) employers included in major financial indexes (e.g., S&P 500, Russell 1000). The data sample has close to 100% coverage of employers represented in these major financial indexes, including the largest corporate employers in the US. Given that the source of the data is job listings on companies' career portals, the dataset is distinct from survey-based data from JOLTS and job listing data from aggregator sites (e.g., Indeed). For the latter, aggregator sites will reflect information that is provided by third parties that aren't necessarily employers, such as staffing and temporary employment firms, search firms, or headhunters.
The LinkUp dataset is a complement to JOLTS, given both its timeliness and granularity. For example, at the time of this writing, JOLTS data on job openings were available for August 2023, while LinkUp data were available through the end of October 2023. JOLTS data are available at the state level, whereas LinkUp job listings contain information on state, city, and zip code.
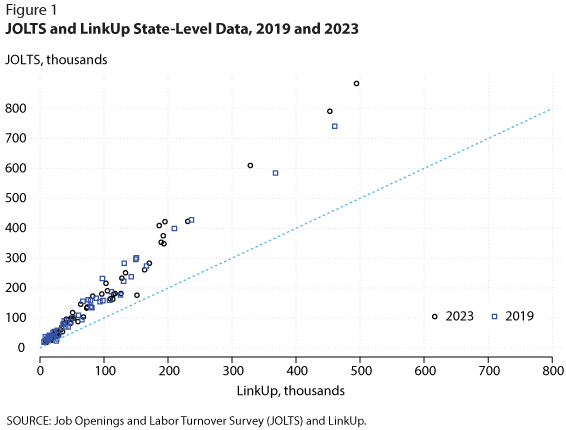
Figure 1 shows job openings in JOLTS compared with job listings in LinkUp. The correlation between the JOLTS and LinkUp data is 0.99 for May 2019 and May 2023. This tight association gives us confidence that using LinkUp data to measure job listings at the city level will capture true local variation in job listings.
Notably, LinkUp data do not capture all the job openings seen in JOLTS. If the LinkUp and JOLTS data were the same, all points in Figure 1 would lie along the dashed 45-degree line. Though LinkUp data are highly correlated with JOLTS, the level of job listings is different. The points lie above the 45-degree line, indicating that, across all states, LinkUp data are missing an average of 46% of the vacancies that are in JOLTS. This means that in levels, the LinkUp data are missing more job listings in larger states than in smaller states.2 Thus, we scale the vacancies in each state or city by the 2019 state-level error, defined as the percent of a state's JOLTS job openings that are missing in the LinkUp data.
Where Is the Labor Market Tightest?
Next, we use this dataset to calculate the number of job listings per unemployed worker in the 100 largest US cities to examine which cities have the tightest labor markets: We take the ratio between the number of job listings from LinkUp and that of unemployed people in each city from the BLS Local Area Unemployment Statistics.
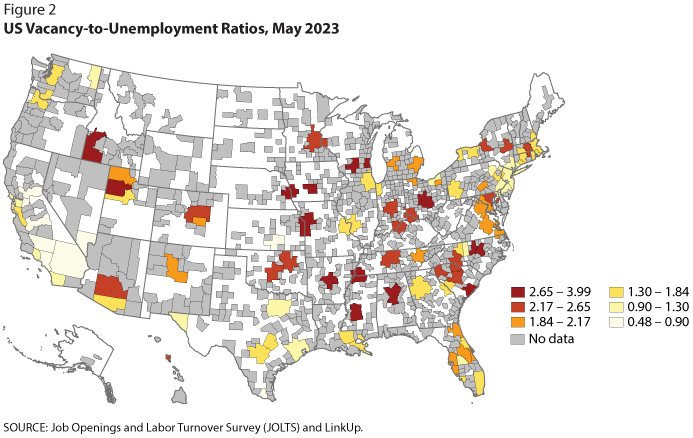
Figure 2 shows labor market tightness in May 2023 for the 100 largest US cities. Darker colors indicate a higher ratio and thus a tighter labor market. Those cities with the tightest labor markets are Jackson, Mississippi; Madison, Wisconsin; and Omaha, Nebraska. Conversely, those with the loosest are Bakersfield, California; Fresno, California; and McAllen, Texas. Narrowing in on metropolitan statistical areas (MSAs) in the 8th Federal Reserve District, all were above the national average (1.58) in May 2023. The average of 8th District MSAs (Little Rock, Arkansas; Louisville, Kentucky; Memphis, Tennessee; and St. Louis, Missouri) was 2.52.
How Has the Labor Market Changed During the Pandemic?
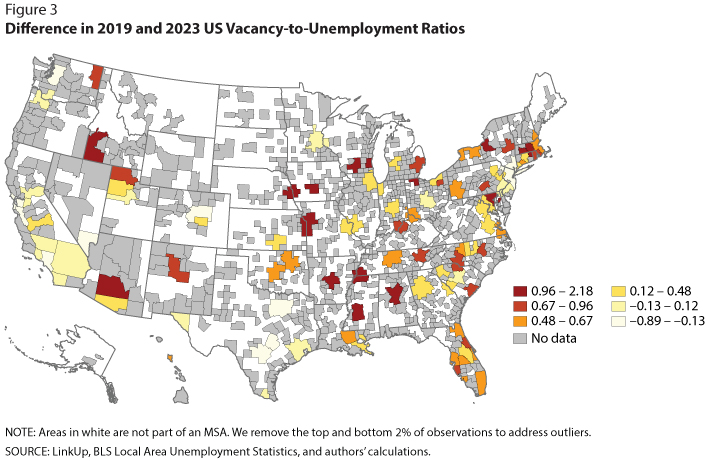
Labor market tightness increased significantly during the pandemic. We explore which cities had the biggest increases by computing changes in VU ratios between May 2019 and May 2023. Figure 3 shows those changes, with darker colors indicating bigger increases in labor market tightness. MSAs with the biggest positive changes in VU ratios (indicating tighter labor markets) are Jackson, Mississippi; Syracuse, New York; and Omaha, Nebraska. Those that have not seen large changes in their VU ratios between 2019 and 2023 are Riverside, California; Bakersfield, California; and Portland, Oregon.
Conclusion
This essay looked at (i) how labor market tightness varies across the 100 largest US cities and (ii) how labor markets have changed since the pandemic. Using the novel dataset on job listings across cities from LinkUp, we were able to compute city-level VU ratios to see which cities have the tightest labor markets and where labor market tightness increased the most during the pandemic. Between May 2019 and May 2023, most of the 100 largest labor markets became tighter. As of May 2023, labor markets in the Midwest were notably tighter than that of the nation overall.
Notes
1 We define a city as a metropolitan statistical area (MSA) and refer to cities and MSAs interchangeably throughout.
2 There is no correlation between the share of job listings that the LinkUp data are missing and the number of job openings in the JOLTS. In other words, the LinkUp data are not systematically missing a larger share of vacancies for states with a larger number of vacancies.
© 2023, Federal Reserve Bank of St. Louis. The views expressed are those of the author(s) and do not necessarily reflect official positions of the Federal Reserve Bank of St. Louis or the Federal Reserve System.