
The Increased Tradability of Natural Gas
Natural gas is a commodity that plays a fundamental role in modern economies. Firms use natural gas as fuel for heating throughout production processes and as an input in the production of chemicals and fertilizers. Many households also use natural gas for cooking and heating.
While most countries need natural gas to various degrees, not all of them have sources of natural gas to supply their domestic economies. These countries face a few alternatives. One option is to rely on alternative sources of fuel that might substitute for natural gas; but for some uses there are no close substitutes. In such cases, international trade can often come to the rescue, by allowing countries without natural gas sources to either (1) purchase gas-dependent goods from countries with those sources or (2) purchase natural gas across borders.
Until recently, international trade of natural gas had been largely restricted to the use of cross-country pipelines. While expanding access for countries without sources of natural gas, pipelines require costly investments and limit the countries from which gas can be purchased to those that are relatively close in proximity. The physical properties of gas make it otherwise hard to store or move in its natural state.
However, over the past 30 years, technological developments have increased the tradability of natural gas by making it easier to turn it into liquid form. The shipping industry has taken advantage of such developments by increasingly using liquefied natural gas (LNG) fleets and terminals. The logistics involved are starkly different from those involved in the conventional trade of goods. To be shipped overseas, natural gas is first liquefied at the source port and then stored in liquid form with an LNG fleet that will carry it to a destination. At its destination port, the natural gas is "regasified" at a dedicated terminal. Each step of this process is necessary and costly, often involving large-scale, long-term investments.
We document recent developments in the tradability of natural gas and investigate potential bottlenecks that may limit the development of this growing market.
1. LNG Trade Has Grown Substantially
Figure 1 illustrates the substantial growth of LNG trade over the past 20 years. Panel A shows that the number of countries involved in LNG trade has grown rapidly. For instance, the number of countries that export LNG has almost doubled, from 12 in 2000 to around 20 in 2021. The number of importers has grown even more rapidly, from 11 in 2000 to 43 in 2021. These changes have naturally also increased the number of LNG trade routes (i.e., the number of exporter-importer pairs).
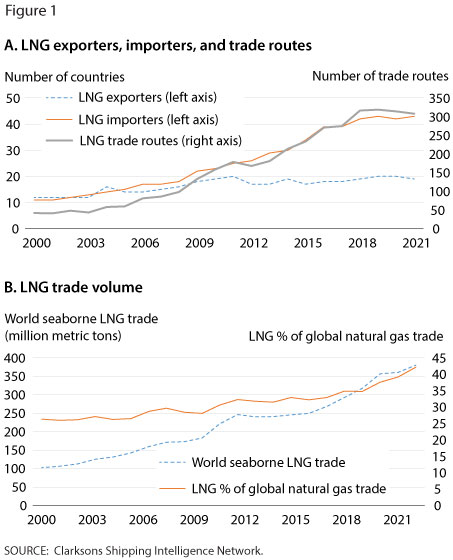
Panel B shows that the volume of global LNG trade has increased substantially, rising from 102.6 million metric tons in 2000 to 380.2 million metric tons in 2021. Moreover, the LNG share of global trade of natural gas has risen from 26% in 2000 to 42% in 2021.
2. LNG Infrastructure Capacity
How has LNG infrastructure grown to support the observed growth of LNG trade? And how much is LNG infrastructure expected to grow in the coming years? We look at three key dimensions of LNG trade logistics: liquefaction capacity, fleet, and regasification capacity.

Figure 2 displays the supply dynamics of all three of these dimensions, expressed in million metric tons per annum (MTPA).1 All three dimensions are necessary steps in LNG trade logistics, so the capacity for LNG trade is necessarily determined by the dimension with the lowest capacity.
Regasification capacity appears to be the least-binding constraint, lying well above the other two series throughout the current period. It is liquefaction capacity that is the most-binding constraint, as it lies well below both regasification and fleet capacity. In fact, liquefaction capacity has been below fleet capacity for the past 18 years or so, with a growing gap that is projected to widen through 2027. These patterns suggest that liquefaction will likely be an important bottleneck for the future growth of LNG trade.2
3. LNG Infrastructure Investments
LNG infrastructure has a critical role in the potential growth of LNG trade. After Russia's 2022 invasion of Ukraine, European countries that have relied on Russian gas have started to diversify their sources3 and are increasingly relying on LNG in their diversification strategy. Figure 3 shows that, after Russia's invasion of Ukraine, there have been increased investments in LNG fleets (new orders in Panel A) and LNG liquefaction terminals (number of terminals expected to be completed in Panel B).4

Conclusion
The LNG market has vastly increased the tradability of natural gas, allowing countries with natural gas sources to benefit through higher sales of gas to countries without such sources. This market has grown significantly in the past 20 years, as LNG has become a viable alternative to pipelines. Given the Russia-Ukraine war, gas-trading countries throughout the world—particularly in Europe—are looking to LNG as a means of maintaining access to gas for their economies. To further expand this market, the industry must expand its regasification capacity, liquefaction capacity, and fleet size.
Notes
1 Total LNG fleet development numbers are originally reported in million metric tons for the whole fleet. We converted this to MTPA (i.e., per annum) by multiplying the total fleet size by an estimate of the total amount of trips the total fleet could make in a year. This value was in turn estimated by the average length of LNG voyages: Per Timera Energy, it ranges from roughly 14 to 30 days. We calculate the series assuming ships travel a median number of 23 days per voyage, or about 16 trips in a year. The lower-bound MTPA estimate using 30 days and 12 trips still maintains the series above liquefaction capacity.
2 Ultimately, these constraints may or may not bind across specific trade routes; that is, they depend on the terminal capacity available across specific exporter-importer pairs. Our discussion abstracts from these considerations and examines the aggregate capacity of each step in the chain.
3 Neely, Chris and Dunn, Jason. "A Shutoff of Russian Natural Gas." Federal Reserve Bank of St. Louis Economic Synopses, 2022, No. 29; https://doi.org/10.20955/es.2022.29.
4 For smoothing, the series on LNG new orders is the 3-month backward-moving average.
© 2022, Federal Reserve Bank of St. Louis. The views expressed are those of the author(s) and do not necessarily reflect official positions of the Federal Reserve Bank of St. Louis or the Federal Reserve System.