
The Allocation of Immigrant Talent in the United States
Immigrants in the U.S. have vastly increased the country's labor supply, bringing along ideas and knowledge from across the world, boosting innovation, growth, and fiscal sustainability.1,2 Yet, despite immigrants accounting for close to 20% of the U.S. labor force, they often do not have an easy time navigating U.S. labor markets. Occupational regulations and licensing, lack of U.S.-specific skills, and outright discrimination, among other barriers, have been previously documented to prevent immigrants from fully achieving their potential—thereby also limiting the aggregate potential of the U.S. economy.
In this essay, we document salient features of the distribution and compensation of immigrant talent across occupations in the U.S. economy. Our goal is to shed light on the extent of immigrant underperformance in U.S. labor markets.
These empirical findings constitute the starting point of our recent working paper, "The Allocation of Immigrant Talent: Macroeconomic Implications for the U.S. and Across Countries," where we quantify the aggregate and distributional costs of these barriers to the economic integration of immigrants, as well as their implications for the design of immigration policy. The goal of this essay is to revisit these empirical findings, revealing the extent of immigrant underperformance in the U.S. while raising a number of questions we address in more detail in the paper.
We use individual-level data from the American Community Survey for 2019 to document key facts on the earnings and participation of immigrants relative to natives across various occupations.3 To simplify the exposition, we partition the set of occupations into the following five groups: non-routine cognitive (e.g., managers, engineers), non-routine manual (e.g., childcare workers, nurses), routine cognitive (e.g., data entry, cashiers), routine manual (e.g., construction, electricians), and non-employment.4,5,6 Moreover, we also group immigrants based on their time since immigration, English proficiency, and income level of their country of origin.

Figure 1 illustrates the distribution of employment between natives and immigrants of different groups across the five occupation categories. Each column in the figure plots the fraction of either natives or a given group of immigrants allocated across the various occupations.
We observe that recent immigrants (0-10 years since immigration) are more likely to be without a job and also less likely to be employed in non-routine cognitive occupations, which are typically the highest-paying occupations. In contrast, the distribution of established immigrants (10+ years since immigration) is much closer to their native counterparts; yet, they are less likely than natives to work in non-routine cognitive jobs and more likely to work in routine manual occupations, which are typically the lowest-paying occupations.
We also find that English proficiency and country of origin are both associated with significant differences in immigrants' labor market outcomes. For instance, almost half of all immigrants with poor English proficiency (Low Eng) are not employed, and most of those that work tend to do so in low-paying manual occupations. Differences are less striking between immigrants from low-income vs. high-income countries, yet we see that immigrants from the latter set of countries are significantly more likely to work in non-routine cognitive occupations than even their native counterparts.
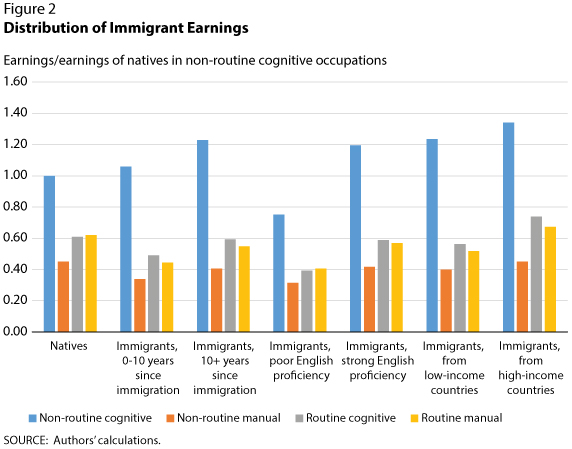
Figure 2 illustrates the distribution of average annual earnings between natives and immigrants of different groups across four alternative occupation categories. Each column in the figure plots the average earnings of either natives or a given group of immigrants when employed in a given occupation; we normalize the earnings of natives in non-routine cognitive occupations to 1.
We observe that the compensation of immigrants differs markedly across occupations. On the one hand, we find that immigrant compensation in non-routine cognitive occupations outperforms natives for all groups of immigrants except those with poor English proficiency. For instance, immigrants from high-income countries earn, on average, close to 40% more than natives in these occupations. On the other hand, immigrant compensation tends to lag natives' compensation in other occupations. In particular, all immigrant groups except those from high-income countries earn less than natives, on average, across non-routine manual, routine cognitive, and routine manual occupations.
To summarize, we find that immigrants in the U.S. tend to systematically underperform their native counterparts in the labor market. They are less likely to be employed in high-paying occupations, and they are more likely to be paid less than natives across most occupations. There are critical exceptions, however. For instance, immigrants are paid more than natives in non-routine cognitive occupations, and immigrants from high-income countries are actually more likely to be employed in these occupations than are natives.
These findings raise the following key question: To what extent does immigrant underperformance reflect barriers immigrants face in U.S. labor markets or, instead, differences in fundamentals (such as productivity or skills) between natives and immigrants? Our recent working paper investigates this question, as well the aggregate, distributional, and policy implications of our findings. We find immigrant barriers in U.S. labor markets are sizable, with significant output gains from removing them, and that the gains from increased immigration are amplified in the absence of such barriers.
Notes
1 The views expressed in this article are solely those of the authors and may differ from official Bank of Canada views. No responsibility for them should be attributed to the Bank of Canada.
2 For instance, see Kerr and Lincoln (2010), Hunt and Gauthier-Loiselle (2010), and Akcigit et al. (2017) for the role of immigrants in U.S. innovation and growth; and see, for instance, Storesletten (2000) for the role of immigrants in U.S. fiscal sustainability.
3 We measure immigrants as the set of foreign-born individuals.
4 Our classification follows Cortes et al. (2020).
5 As classified by Autor et al. (2003), an occupation is considered routine if the required tasks in the occupation can be summarized by well-defined instructions and procedures. If tasks in an occupation require more flexibility, human interaction, and problem-solving skills, then the occupation is non-routine. If tasks in an occupation require more physical activity, it is considered a manual occupation, while an occupation requiring mental tasks is considered a cognitive occupation.
6 Non-employment includes both unemployment and non-participation.
References
Akcigit, Ufuk; Grigsby, John and Nicholas, Tom. "The Rise of American Ingenuity: Innovation and Inventors of the Golden Age." National Bureau of Economic Research, No. w23047, 2017.
Autor, David H.; Levy, Frank and Murnane, Richard J. "The Skill Content of Recent Technological Change: An Empirical Exploration." Quarterly Journal of Economics, 2003, 118(4), pp. 1279-1333.
Birinci, Serdar; Leibovici, Fernando and See, Kurt. "The Allocation of Immigrant Talent: Macroeconomic Implications for the U.S. and Across Countries." Federal Reserve Bank of St. Louis Working Paper No. 2021-004C, June 2022; https://research.stlouisfed.org/wp/more/2021-004.
Cortes, Guido Matias et al. "The Dynamics of Disappearing Routine Jobs: A Flows Approach." Labour Economics, 2020, 65, Article 101823.
Hunt, Jennifer and Gauthier-Loiselle, Marjolaine. "How Much Does Immigration Boost Innovation?" American Economic Journal: Macroeconomics, 2010, 2(2), pp. 31-56.
Kerr, William R. and Lincoln, William F. "The Supply Side of Innovation: H-1B Visa Reforms and U.S. Ethnic Invention." Journal of Labor Economics, 2010, 28(3), pp. 473-508.
Storesletten, K. "Sustaining Fiscal Policy Through Immigration." Journal of Political Economy, 2000, 108(2), pp. 300-23.
© 2022, Federal Reserve Bank of St. Louis. The views expressed are those of the author(s) and do not necessarily reflect official positions of the Federal Reserve Bank of St. Louis or the Federal Reserve System.