
Neighborhood Types and Intergenerational Mobility
The intergenerational mobility of a society describes the extent to which an individual can attain a socioeconomic status that is different from that of their parents. In more mobile societies, children are likely to move up (or down) in terms of income, wealth, or other economic outcomes. Chetty and Hendren (2018) document wide variation in intergenerational mobility across different neighborhoods in the United States.1 In our earlier essay, "Neighborhood Types and Demographics," we showed how neighborhoods in the United States can be organized into five distinct types based on racial composition and educational attainment. In this essay, we incorporate data on intergenerational mobility and examine its relationship with job growth within each neighborhood type.
Data, Methodology, and Neighborhood Types
In our first essay, our data source for neighborhood outcomes is Opportunity Insights.2 There, we use a k-means clustering method to assign each Census tract (statistical subdivision of counties) to one of five types of neighborhoods. We group these neighborhood types according to their racial composition (the share of White, Black, Asian, and Hispanic residents and percent of residents who are foreign born) and educational attainment (share of residents with a four-year college degree). The neighborhood types are ordered from lowest to highest median income.

As shown in Table 1, Types 1 and 2 have a majority of Black and Hispanic residents, respectively. While Types 3 and 5 are predominantly White, they differ in educational attainment. Finally, the racial composition and educational attainment of Type 4 represent those of the United States as a whole.
Economic Mobility and Job Growth
Next, we show how our grouping of neighborhoods helps us better understand any links between intergenerational mobility and job growth. Ex ante, we may expect to find a positive relationship between intergenerational mobility and job growth, as children that reach the top quintile of income as adults are likely to create opportunities for others in their neighborhoods. Or the underlying mechanism can go the other way: Growing neighborhoods produce intergenerational mobility since they offer more opportunities for children.
We use Opportunity Insights' measure of intergenerational mobility by Census tract. The mobility measure is the probability that children born in a given neighborhood type reach the top quintile of the national individual income distribution in 2014 and 2015. We also use Opportunity Insights' job growth measure, which is the annualized change in the number of employed workers between 2004 and 2013. Figure 1 displays binned scatter plots of the relationship between these two measures for the five neighborhood types, and Table 2 displays the corresponding means of these variables and the slopes of the lines of best fit.
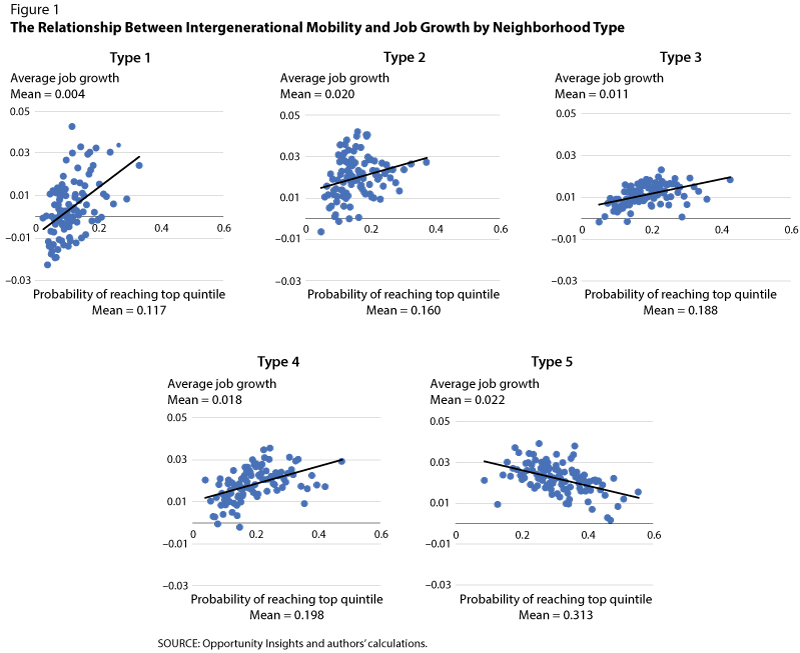

The average probability of reaching the top 20% of national income increases with each neighborhood group, moving from 11.7% for Type 1 to 31.3% for Type 5. Similarly, Type 1 has the lowest job growth, 0.4% per year, while Type 5 has the highest, 2.2% per year.
Next, we turn our attention to the slopes of the lines in Figure 1. Types 1 to 4 exhibit positive relationships between economic mobility and job growth. While Type 1 has the lowest average probability of children reaching the top quintile of income as adults, Type 1 sees the largest increase in job growth for every increase in probability of reaching the top quintile of income, indicating that it has the strongest relationship between economic mobility and job growth of all five groups. For Type 5, however, economic mobility and job growth have a negative relationship, even though Type 5 has the highest average job growth and economic mobility. As the probability of children reaching the top quintile of income increases, job growth decreases. This heterogeneity across neighborhood types contributes to a low correlation in the aggregate, 0.049.

Why might we see this negative relationship in Type 5 neighborhoods? One plausible explanation is that, for a neighborhood to capture positive spillover effects and job creation from children that become upwardly mobile adults, those adults must stay near their childhood homes. The Opportunity Insights data contains this information, so we can check this directly. As Figure 2 shows, Type 1 and Type 2 neighborhoods have the highest stay rates of the neighborhood types. Types 1 and 2 also have the strongest relationship between intergenerational mobility and job growth. Therefore, they are the types most likely to capture the positive economic effects of their children reaching the top quintile of national income as adults. In contrast, Type 5 has the lowest stay rates and also a negative relationship between mobility and job growth. Hence, the propensity for individuals to move away from their childhood homes may be one driver of the relationships documented in Figure 1.
To summarize, neighborhoods across the U.S. exhibit both systematic differences in racial and educational composition as well as economic relationships and outcomes. In most neighborhoods types, upward economic mobility correlates positively with job growth. We have shown, however, that neighborhood stay rates are important factors in capturing the positive effects of economic mobility.
Notes
1 Chetty, Raj and Hendren, Nathaniel. "The Impacts of Neighborhoods on Intergenerational Mobility II: County-Level Estimates." Quarterly Journal of Economics, August 2018, 133(3), pp. 1163-228; https://doi.org/10.1093/qje/qjy006.
2 See https://opportunityinsights.org/data/.
© 2022, Federal Reserve Bank of St. Louis. The views expressed are those of the author(s) and do not necessarily reflect official positions of the Federal Reserve Bank of St. Louis or the Federal Reserve System.