
Construction Permits and Future Housing Supply: Implications for 2020
House prices in recent years have experienced growth rates similar to those seen during the 2002-06 housing boom.1 To ensure the U.S. housing market remains healthy, the construction of new housing units across U.S. regions needs to remain in balance with growth in demand; otherwise, house prices might deviate from the long-run trend growth. However, this balance can be difficult to achieve because new housing takes time to build, which forces real estate developers to forecast future market demand. The delays involved with getting permits and finishing construction require that developers time the market well.
As a result, housing permits reflect expectations regarding the future of newly constructed housing units. We believe that housing permits lead house prices because these permits are forward looking. The purpose of this essay is to put into perspective recent movements of house prices and permits, both nationally and regionally, and what they may signal regarding expectations.
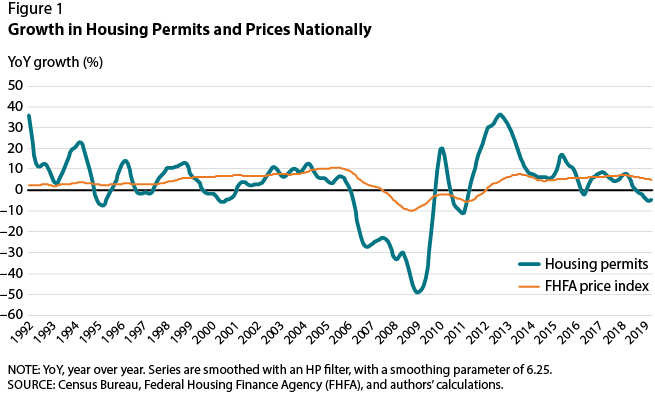
To compare the evolution of these two variables, we calculate the percent change in national housing permits from a year ago and use the Federal Housing Finance Agency's national house price index. We filter the data using the Hodrick-Prescott (HP) filter to eliminate some of the high-frequency noise and arrive at a smoother trend component.2 The national measures for these variables from 1992-2019 are plotted in Figure 1. Housing permits are volatile and reveal frequent episodes of large upturns and downturns in construction. By comparison, with the notable exception of 2007-11, national house prices generally increase over time and are more stable.
Interrupting the past several years of growth, a decline in housing permits has started over the past year while the growth in national house prices has begun to moderate. From a historical perspective, the recent housing slowdown is notable but by no means extreme. The United States experienced a similarly mild decline in permits prior to the 2001 recession and before that in the mid-1990s when no subsequent recession materialized.
Looking beyond the housing market itself, a decline in permits can negatively impact economic growth because permits become houses once construction is complete, which in turn are major components of residential fixed investment. In 2018, residential fixed investment was more than $602 billion, which amounted to approximately 3 percent of GDP. If the trend continues, the 5 percent drop in average monthly housing permits in 2019 could signal a sizable decline in residential fixed investment and GDP for 2020.
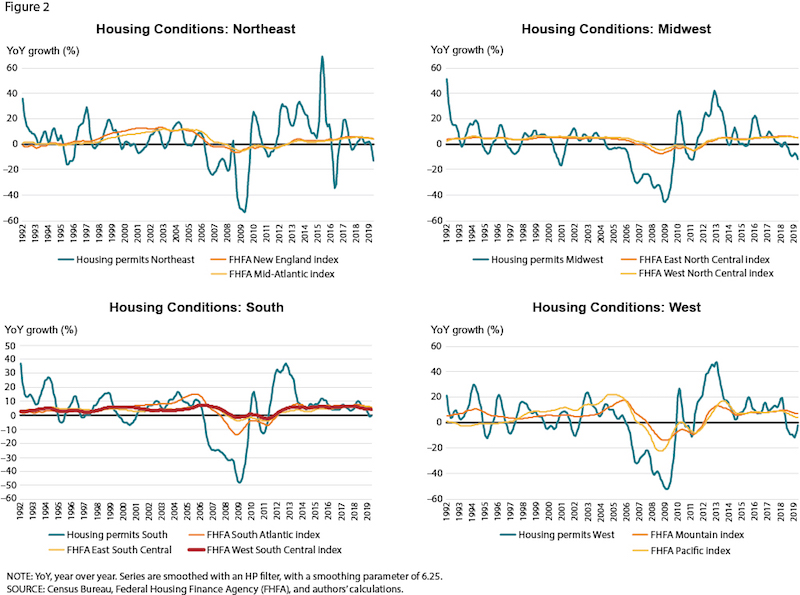
Sometimes these national trends are reflected throughout the United States, while at other times starker regional differences emerge between the Northeast, Midwest, South, and West. As can be seen in Figure 2, most of the country has experienced stable house price growth over the past two years, except for the West where there has been a notable slowdown. Housing permits have slowed or declined in all four regions, although by varying magnitudes and along different timelines. For the Northeast and Midwest, housing permit growth began slowing in 2017 and has continued to slide. By contrast, the West witnessed a rather abrupt reversal in permits from its growth of 20 percent to a decline of around 10 percent beginning in 2018. Meanwhile, permit growth in the South has been relatively low but also more stable, revealing only a modest reduction over the past year.
Together, these disaggregated trends paint a picture of a slowdown in permits that began in the Northeast and Midwest in 2017 and subsequently translated to sharper declines in the West, with the South maintaining relatively more stable housing conditions by comparison. Moreover, even though the West experienced the sharpest drops in permits, it has recently shown signs of recovery, whereas the Northeast and Midwest continue to deteriorate.
Overall, the data confirm that the decline in housing permits is occurring throughout much of the country, potentially signaling declining expectations for future housing demand and prices. If these conditions continue, the likely result will be some degree of softness in the housing market for 2020.
Notes
1 For a more detailed analysis of the recovery in the housing market, see https://research.stlouisfed.org/publications/economic-synopses/2019/08/20/are-u-s-housing-markets-hot-hot-hot.
2 HP filtering is a method used in macroeconomics to smooth data series and separate cyclical components of time series from long-run trends. In this analysis, we use the trend component of an HP filter.
© 2019, Federal Reserve Bank of St. Louis. The views expressed are those of the author(s) and do not necessarily reflect official positions of the Federal Reserve Bank of St. Louis or the Federal Reserve System.