
Are U.S. Housing Markets Hot, Hot, Hot?
As of July 1, 2019, the United States has experienced the longest economic expansion on record. This long period of stable growth started after the 2007-09 Great Recession, which is remembered for both the turmoil in financial markets and the collapse in the housing market.
Recent empirical work has documented that, in addition to large declines in housing prices (often exceeding 30 percent in some areas), selling delays rose significantly as average time on the market (TOM) increased by several months.1 For the purpose of this essay, we define housing liquidity as the average TOM of homes in a particular location. This deterioration stood in stark contrast to the preceding period when properties sold quickly, making housing an extremely liquid investment. Since the housing crisis of 2007-11, housing prices and liquidity have largely recovered or exceeded their pre-crisis levels, with some areas running hotter now than during the 2002-06 boom.
We use heat maps to compare current and past housing conditions; specifically, the appreciation of housing prices and the increase in housing liquidity in the housing boom prior to the housing crisis (2002-06) and in the second housing boom after the crisis (2013-17).
Housing Conditions, 2002-06 and 2013-17
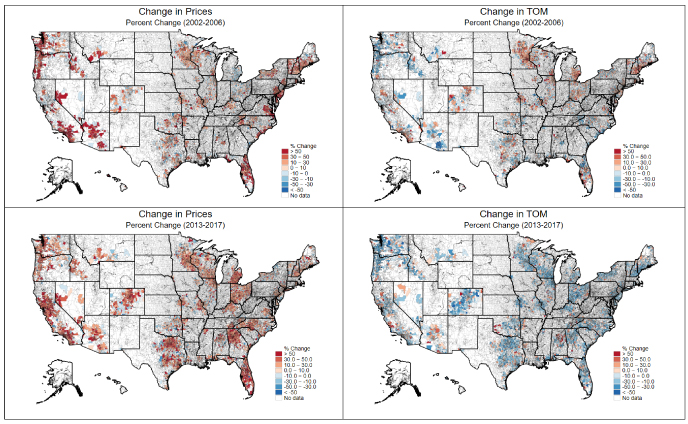
NOTE: TOM, time on the market.
SOURCE: Multiple Listings Service.
The maps in the figure show changes in real housing prices and TOM by zip code for the two time periods. Despite some gaps, the data cover many of the major metropolitan areas in the United States and, hence, a majority of the population. The colors correspond to percentage changes for each variable: As shown in the legends, changes approach red as they become more positive and approach blue as they become more negative.
In looking at prices during the 2002-06 and 2013-17 booms, one can see there is significant variation in the geography and intensity of the price increases over time. The 2002-06 boom appears to have been heavily concentrated along both coasts. Housing prices in metropolitan areas of Florida, the Northeast, the Pacific Northwest, and the southwest increased dramatically. Much of the Midwest and central parts of the country experienced more modest price increases or, in some cases, decreases. The geography of the more recent housing boom is very different, as the Midwest has seen large price increases and Texas and Northern California have become new hot spots. The post-crisis period is also characterized by significantly cooler housing markets in the Northeast and parts of the Sunbelt such as Arizona.
When it comes to housing liquidity, there was significant regional heterogeneity during the 2002-06 boom. In particular, some metro areas experienced higher liquidity in the form of declining TOM; others saw TOM rise; and still others saw a mix of activity across the different counties within the metro area. However, the post-crisis period of 2013-17 saw housing liquidity improve nearly everywhere. There are some notable exceptions in Arizona and even California, but most of the country experienced greater housing market liquidity during this time.
There are two likely explanations for the increase in housing liquidity during the post-crisis period. One possibility is that the housing market is simply returning to its pre-crisis normal state when housing was relatively liquid. As economic conditions have improved amidst the backdrop of record-low mortgage rates, rising demand for housing manifests itself through both higher prices and faster sales. Empirical analysis supports this statement, as the average TOM of around 131 days remained stable during 2002-06. From an aggregate perspective, the pre-crisis housing boom did not substantially change liquidity. However, from 2013-17, the average TOM decreased from 157 days to 129 days. This supports the view that the post-crisis period began with a more illiquid market and that the recent boom has restored the pre-crisis liquidity.
An alternative interpretation of the recent increase in liquidity is that the crisis or other structural factors have fundamentally changed the housing market; for example, the contribution of local and out-of-town institutional investors across metropolitan housing markets. This raises the question of whether we could see more liquid housing markets in the future. However, the most current micro-level transaction data have not yet become available, limiting the scope of the analysis to evaluating whether the downward trend in housing liquidity has continued or plateaued.
Housing markets today look as good as or better than they did in 2006. The restoration of the housing market has been assisted by extremely accommodative monetary policy, despite the recent normalization process. In the July press conference, Federal Reserve Chair Powell stated that the Federal Open Market Committee was cutting rates in 2019 to drive inflation expectations to target. With the housing market at its current level, more accommodation could drive housing markets to historical heights.
Note
1 Garriga, Carlos and Hedlund, Aaron. "Mortgage Debt, Consumption, and Illiquid Housing Markets in the Great Recession." Working Paper No. 2017-030A, Federal Reserve Bank of St. Louis, July 2019.
© 2019, Federal Reserve Bank of St. Louis. The views expressed are those of the author(s) and do not necessarily reflect official positions of the Federal Reserve Bank of St. Louis or the Federal Reserve System.