
Predicting the Yield Curve Inversions that Predict Recessions: Part 2
In Part 1 of this two-part series we discussed the significance of yield curve inversions and the predictive power of various leading indicators toward yield curve inversions and recessions. Our conclusion was that current macroeconomic variables have some predictive power for recessions but generally are preceded by yield curve inversions. In Part 2, we explore to what extent expectations of future economic activity begin to decline prior to yield curve inversions.
Expectations and Sentiment in the Housing Market
Historically, yield curve inversions have been correlated with economic recessions, which generally follow about a year after an inversion. The yield curve captures expectations and economic sentiment, and an inversion reflects investors' view that current economic conditions are stronger than future ones. In this essay, we examine housing expectations, as we have already examined current housing production in Part 1 of this series by using construction employment as a proxy. Yield curve inversions and the housing market may be related because the housing market is particularly sensitive to movements in interest rates. When investors become pessimistic about the future, they are less likely to engage in long-term investment such as housing, which can have volatile pricing. Housing developers need to anticipate future economic conditions, as the construction of housing is a lengthy process, and purchases or acquisitions are extremely dependent on credit conditions.
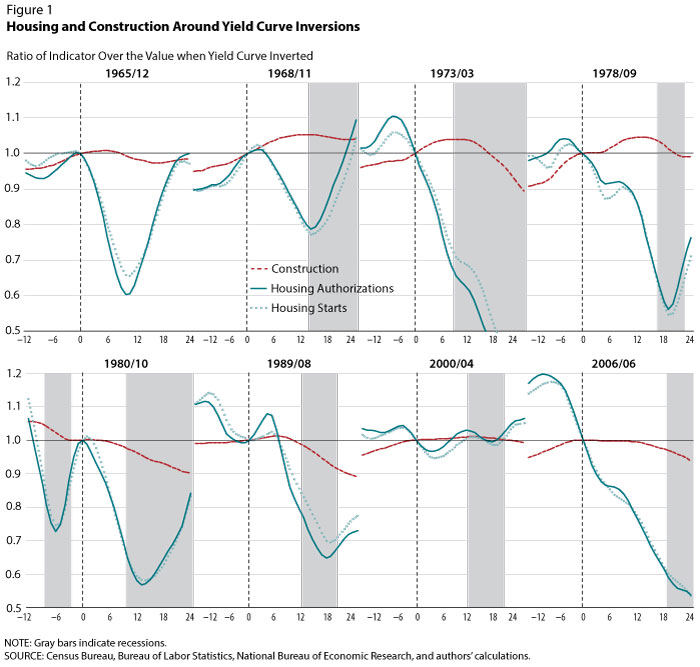
Figure 1 plots monthly data series of housing permits (authorizations) around the start of yield curve inversions. The graphs are constructed such that the dates displayed indicate in which month the yield curve inverted, and each graph plots economic activity for one year before and two years after an inversion. The plots are normalized so that the dates of yield curve inversions are labeled as 0 on the x-axes and as 1 on the y-axes. Gray bars indicate recessions. The graphs demonstrate that, since 1973, the U.S. economy has experienced a significant decline in housing starts and permits prior to a yield curve inversion.
Part 1 of this series demonstrates that this behavior is not the case with all leading indicators of recessions. Contemporaneous macroeconomic activity was shown to generally decline before recessions, but not before yield curve inversions. In this case, we analyze future housing behavior by plotting essentially the number of houses authorized to be built in the near future. Figure 1 demonstrates that housing expectations consistently decline before a recession—before even yield curve inversions in many cases. Given the frequency of this phenomenon with housing expectations, the evidence makes it reasonable to expect that future housing trends will experience downturns before a yield curve inverts.
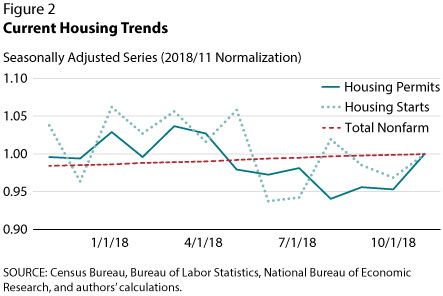
If housing starts and permits have some predictive power over yield curve inversions, a relevant question is where are we today in terms of predicting an inversion and eventually a recession? Figure 2 plots monthly housing authorizations for the past year. Since obtaining a peak of 1.37 million units in March 2018, housing permits declined around 8 percent to 1.27 million units in October 2018. This is a notable decline in future housing expectations, and it appears to be in line with historical housing trends prior to yield curve inversions. With the spread between long- and short-term Treasury notes hovering between 10 and 20 basis points and housing expectations experiencing significant declines, it seems likely that the yield curve will invert in the relatively near future.
Housing expectations have been shown to be an important indicator of future economic activity and should be considered when forecasting recessions. Given the evidence presented in this essay, this simple forecast implies that a yield curve inversion will be preceded by a decline in housing expectations and be followed by a recession approximately a year later.
© 2019, Federal Reserve Bank of St. Louis. The views expressed are those of the author(s) and do not necessarily reflect official positions of the Federal Reserve Bank of St. Louis or the Federal Reserve System.