
Does a State’s Political Stance Impact Its Government Revenues and Spending?
Traditionally, conservatives favor a government of limited size and advocate for reductions in taxes and government spending, while liberals favor a larger, more active government. A larger government requires a higher level of public spending, which necessitates higher revenue to avoid increasing the deficit. Hence, it is reasonable to expect that largely conservative states collect less revenue and spend less than largely liberal states. Could a long-standing conservative (liberal) state effectively implement its political agenda and reduce (increase) the size of the government? We examine whether the political leaning in each state influences its state and local government revenues and expenditures.
To gauge each state's government finances, we calculate state and local government revenues and expenditures as a percentage of state-level gross domestic product (GDP).1 In 2014, revenue ranged from 12.6 percent of state-level GDP in Texas to 24.5 percent of state-level GDP in Alaska. Similarly, state and local government expenditures accounted for 12.2 percent of state-level GDP in Texas and 25 percent of state-level GDP in Alaska.
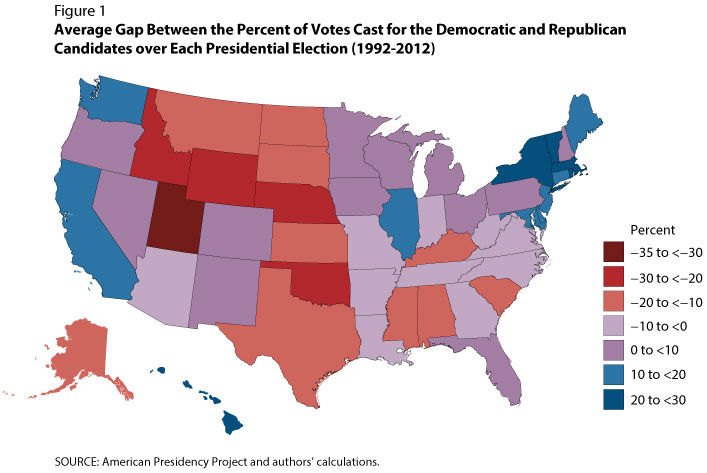
We measure the political leaning of each state according to votes in presidential elections from 1992 to 2012: That is, we use the average gap between the percent of votes cast for the Democratic candidate and the percent of votes cast for the Republican candidate. Positive values indicate that the Democratic candidates averaged a higher share of votes than did the Republican candidates, while negative values indicate the opposite. We chose this measure of states' political leanings because people often associate red (conservative) and blue (liberal) states with presidential election results. In addition, finding data on other measures, such as party associations of state officials, is quite costly. Because public finance policy typically evolves over time, we average results over these six elections to capture the political leaning over several decades. Figure 1 maps this measure and shows that it is in line with the popular notion that states in the Northeast and on the West Coast lean more liberal.

Figures 2A and 2B plot the relationships between political leaning and state and local government revenues and expenditures. The results exhibit no discernible patterns, in contrast with the traditionally held perception. The correlation coefficients between state and local government revenues and expenditures to state-level GDP ratios and the average election results are 0.02 and 0.04, respectively.2 That is, we find little evidence that state and local government revenues and expenditures as a share of state-level GDP correlate with the political leaning of each state. Therefore, in this sense, political leaning might not play a dominant role in state and local government finances.
However, this simple exercise overlooks many aspects. We do not examine the composition of revenues and expenditures across states, which may vary with political leaning. In addition, a state's position on the political spectrum might also reflect on other issues that fall outside government finances, such as gay marriage or immigration.
Notes
1 GDP by state sums the total value added across all industries in the state. We use state and local revenue and expenditure data for 2014 provided by the Census Bureau's Annual Survey of State and Local Finances. We exclude non-general revenue and expenditure sources, such as utilities, liquor stores, and insurance trusts. We divide revenues and expenditures by state-level GDP to control for state-level effects, which could bias our analysis. For example, if a state is richer, it could collect more revenue and spend more regardless of its political position.
2 The correlation coefficient measures the linear relationship between two variables and ranges from –1 to 1, where –1 indicates a perfect negative relationship, 0 indicates no linear relationship, and 1 indicates a perfect positive relationship.
© 2017, Federal Reserve Bank of St. Louis. The views expressed are those of the author(s) and do not necessarily reflect official positions of the Federal Reserve Bank of St. Louis or the Federal Reserve System.