
State Variation of Tax Deductions
The tax proposal President Trump outlined in late April includes many significant changes, including some to standard and itemized deductions. Taxpayers can choose a standard deduction or itemize deductions, with either form then subtracted from taxable income. A larger deduction means a lower tax bill. The tax proposal intends to double the standard deduction and eliminate many eligible expenses from itemized deductions, keeping deductions only for mortgage interest payments and charitable contributions.1 These proposed changes to tax deductions are likely to affect residents in some states more than others, as the fraction of taxpayers who itemize deductions and the composition of the deductions claimed vary significantly across states.

Using tax return data for 2014 (the latest available), Figure 1 maps the percentage of tax returns that itemize deductions. States with a darker shade of blue have a larger share of residents who itemize. The percentages range from 17.1 percent in West Virginia to 45.4 percent in Maryland. Whereas the standard deduction is a flat amount, total itemized deductions vary according to eligible deduction expenses, so itemized deductions will be claimed at a higher rate where residents tend to have higher levels of eligible expenses. For example, mortgage interest payments tend to rise with housing prices and state and local taxes vary.2
A doubling of the amount of the standard deduction obviously would benefit taxpayers who take the standard deduction. From this angle, states with a higher percentage of taxpayers taking the standard deduction would have more people benefit from the proposed changes. However, the impact of the proposed changes on itemized deductions is less obvious. Not only does the fraction of taxpayers who itemize deductions vary widely across states, but the composition of eligible expenses deducted also varies widely.
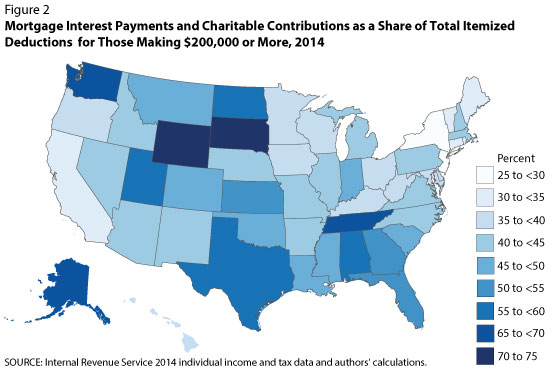
We examine mortgage interest payments and charitable contributions, the two eligible expenses remaining under the tax proposal, relative to the total amount of itemized deductions claimed. Many taxpayers who now itemize deductions would likely switch to the standard deduction if it were doubled, so we focus on taxpayers with taxable income of $200,000 or higher because they remain likely to use itemized deductions after the changes.3 Figure 2 maps mortgage interest payments and charitable contributions as a share of total deductions among those taxpayers. Darker shades of blue indicate a higher share. There is still significant variation across states even after controlling for income. New Jersey has the lowest share at 28.9 percent, while South Dakota has the highest share at 73.3 percent. An alternative measure of variation is the average value of the two remaining deductible expenses, which ranges from nearly $19,000 in New Jersey to $86,000 in Wyoming.
However, the information provided in Figure 2 is not sufficient to evaluate the final impact of the tax proposal on high-income residents across states because of the alternative minimum tax (AMT). The AMT is calculated under a parallel set of rules and acts as a lower bound on taxpayers' final bills. The AMT disallows many of the expenses that can be itemized, with the major exceptions being charitable contributions and qualified mortgage interest payments. Therefore, the changes to itemized deductions might have little effect on those households subject to the AMT because their tax bills under the new proposal could be essentially unchanged. To fully analyze this, we need detailed information on households who paid taxes under the AMT, which is not available in this dataset.
The president's tax proposal puts forth many changes to the individual income tax codes. Despite the fact that U.S. federal tax codes are applied uniformly to all taxpayers, the changes to the deductions are likely to have different impacts at the state level. Changes to the tax code may alter the incentive to incur those deductible expenses. Our estimates use tax data from 2014 and thus do not take into account these possible changes in behavior. Without a concrete economic model, it is difficult to evaluate the impact of taxpayers' responses to the tax code changes. However, the fact remains that the impact of the proposed changes to the tax code will vary significantly across states.
Notes
1 Rappeport, Alan. "The 7 Key Elements of the White House Tax Plan." New York Times, April 26, 2017; https://www.nytimes.com/2017/04/26/us/politics/white-house-tax-plan.html?_r=0.
2 See Cole, Alan. "Which Places Benefit Most From State and Local Tax Deductions?" Tax Foundation, April 27, 2017; https://taxfoundation.org/map-state-and-local-deductions/.
3 Our initial analysis in June 2017 shows that most taxpayers are expected to use the standard deduction except for the high-income group. See Chien, Yili and Morris, Paul. "Standard Vs. Itemized Deductions: How the New Tax Proposal Could Affect the Decision." Federal Reserve Bank of St. Louis On the Economy (blog), June 20, 2017; https://www.stlouisfed.org/on-the-economy/2017/june/standard-itemized-tax-proposal-affect-decision.
© 2017, Federal Reserve Bank of St. Louis. The views expressed are those of the author(s) and do not necessarily reflect official positions of the Federal Reserve Bank of St. Louis or the Federal Reserve System.