Does Data Confusion Equal Forecast Confusion?
Forecasters, policymakers, and financial market participants closely scrutinize the regular economic data flows for signs about the economy's future strength. But there are many types of data. Some of these data measure goods and services that are produced and consumed each month, while other types of data measure economic sentiment or financial market variables. Over the past few months, a noticeable discrepancy has developed between the types of data that forecasters and others regularly use to assess the strength or weakness of the U.S. economy, as measured by real GDP growth in the current quarter.
One type of data is the regular flow of monthly data from government statistical agencies and other sources that are used in the construction of real GDP. Examples include key monthly series like real personal consumption expenditures (PCE), light vehicle sales, construction spending, shipments of nondefense capital goods, business inventories, and exports and imports of goods and services. These types of data are often referred to as "hard" data.
However, other types of data are also scrutinized for clues about the economy's health. These include data derived from surveys of businesses, consumer confidence and sentiment surveys, and financial market variables such as stock prices and the St. Louis Fed's Financial Stress Index. Other closely watched data that do not flow directly into the calculation of real GDP, but which are viewed as key indicators of economic health, are important labor market series such as the number of jobs added or subtracted each month, the unemployment rate, and initial weekly claims for state unemployment insurance benefits. These types of data are often referred to as "soft data."1

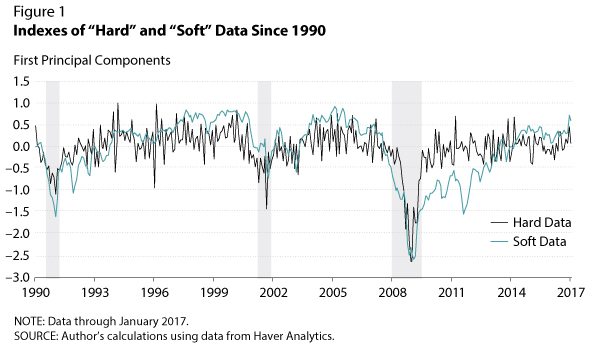
This essay provides two new index measures of "hard" and "soft" data that could be useful for quantitatively showing how different types of data can influence forecasts of real GDP and thus the expectations of policymakers. Figure 1 shows the monthly indexes of hard and soft economic data. The hard data index uses 16 data series and the soft data index uses 13 series.2
The indexes exhibit the normal cyclical behavior one would expect in the data: They increase in expansions and decrease in recessions.3 Figure 1 shows that early in the expansion, until late 2013 or so, there was a considerable gap between the hard and soft data; the hard data indicated stronger economic conditions than the soft data. However, this has since reversed, with the soft data now indicating stronger economic conditions than the hard data.

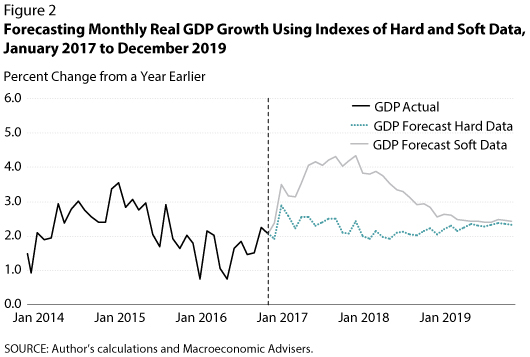
To gauge how differently these two types of data are influencing perceptions of the near-term economic outlook, Figure 2 shows forecasts of monthly real GDP growth using a simple vector autoregression (VAR) model.4 Given recent weakness in some of the hard data, it is perhaps not too surprising that the forecasts of monthly real GDP growth using the hard data are appreciably weaker—with expected quarterly GDP growth averaging a little more than 2 percent from 2017 to the end of 2019, which is consistent with the pattern of growth seen during this expansion (about 2.1 percent). In contrast, forecasts using the soft data show that considerable strengthening in the U.S. economy is likely over the next two years. Figure 2 indicates that real GDP growth projected using the index of soft variables peaks at a little more than 4 percent in early 2018.

The table shows how these VAR forecasts compare with the consensus forecasts produced by the Federal Reserve Bank of Philadelphia's Survey of Professional Forecasters and the FOMC's March 15, 2017, Summary of Economic Projections. Again, the hard data are consistent with the forecast consensus, while the soft data depict an outlook that is much stronger.
In view of these persistent tensions in key economic data over the past few months, most forecasters and FOMC policymakers have decided to rely on the hard data flows when forecasting the near-term outlook. This is probably prudent, since the hard data flows are used in most macroeconomic forecasting models. One notable example in this regard is the Federal Reserve Bank of Atlanta's GDPNow model, which is currently predicting real GDP growth of 1.0 percent in the first quarter. However, as the upbeat forecasts from the soft data show, there appears to be some upside risk to the near-term forecast for real GDP growth. This upside risk likely reflects the widespread expectation of expansionary fiscal policy and a strengthening in global growth. In this regard, one notable example is the Federal Reserve Bank of St. Louis's Economic News Index (ENI), which relies on a few key soft data series. The ENI is currently predicting growth of 2.7 percent in the first quarter.5
Notes
1 This is a common characterization among economists engaged in economic analysis and forecasting.
2 Each index is constructed using principal components, with the index as the first principal component; this is the same statistical method used to construct the St. Louis Fed's Financial Stress Index. An online appendix provides a list of the data series and the mathematical transformations (e.g., log levels or differences) used to construct each index.
3 Each principal component is multiplied by –1 to mimic the natural cyclical behavior of the data.
4 I estimate two bivariate VARs. Both include real GDP growth (12-month percent change, in natural logs) and an index variable. The first VAR includes real GDP growth and the index of hard data. The second VAR includes real GDP and the index of soft data. The model uses 12 lags of the dependent (real GDP growth) and independent (index) variables. Actual monthly real GDP is calculated by Macroeconomic Advisers, LLP, and is used by the National Bureau of Economic Research Business Cycle Dating Committee to help date peaks and troughs in the U.S. business cycle.
5 The author thanks Brian Levine for research assistance.
© 2017, Federal Reserve Bank of St. Louis. The views expressed are those of the author(s) and do not necessarily reflect official positions of the Federal Reserve Bank of St. Louis or the Federal Reserve System.


 follow @stlouisfed