
U.S. Fiscal Policy: Reality and Outlook
The current state of the federal government's fiscal policy has been largely determined by the response to the Great Recession and the ongoing expansion of government transfers. The fiscal measures undertaken to mitigate the impact of the previous recession resulted in deficits of unprecedented magnitude for the postwar period and a prolonged, politically contentious period of normalization. At the same time, demographic trends and the continuing expansion of the social safety net imply a sustained growth in transfers and, likely, rising deficits for the foreseeable future.
The figure shows key variables of the U.S. federal budget: revenues, outlays, deficit, and debt held by the public, all expressed in terms of gross domestic output (GDP).1 The figure also shows the most recent 10-year projections by the Congressional Budget Office (CBO).

Prior to the Great Recession, revenues averaged about 17.5 percent of GDP. The two most recent recessions (March to November 2001 and December 2007 to June 2009) prompted a series of tax provisions that significantly reduced tax revenues. In 2013, tax rate cuts that were made permanent for some taxpayers were reversed for high-income earners: As a result, revenues as a share of GDP returned to normal levels and are expected to average about 18.1 percent over the next decade.
On average, outlays are larger than revenues; the interest paid on the debt explains this difference. During the 1990s, outlays as a share of GDP were on a marked downward trajectory that was reversed in the 2000s. More recently, the sequence of fiscal actions taken in response to the Great Recession resulted in a big surge in outlays, reaching a postwar record of 24.4 percent of GDP in 2009. Despite the subsequent drop, outlays remain elevated relative to pre-recession levels and are projected to continue rising over the next decade.
The drop in revenues and the increase in outlays around the time of the Great Recession created unprecedented deficits (for the postwar period). Just like outlays, the deficit peaked in 2009, remains high today, and is projected to continue growing.
Deficits imply debt accumulation. Government debt as a share of GDP declined in the second half of the 1990s and remained relatively constant until the Great Recession. The large deficits of 2009-13 have more than doubled the debt held by the public. The most recent CBO projections estimate that debt will reach 75.4 percent of GDP by the end of 2016 and 85.6 percent of GDP by 2026. These figures are very high for peacetime in the United States but are not necessarily alarming compared with debt levels in other developed countries.
The table displays major components of the federal budget averaged over selected periods and clearly shows that the changes in the size of the federal budget are not as dramatic as those in its composition, particularly outlays.
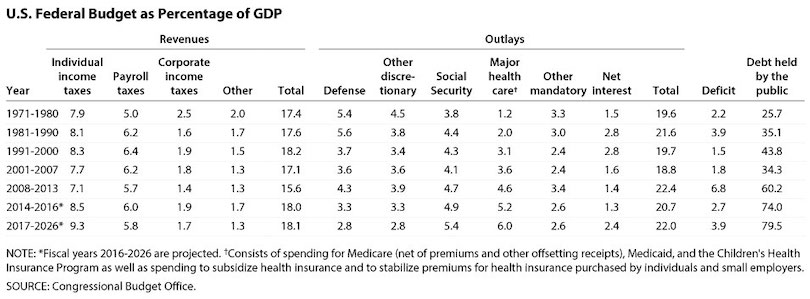
The table shows how the bulk of the tax provisions enacted during the Great Recession provided tax relief to individuals through reductions in both income and payroll tax rates. Individual income taxes are projected to bear an increasing burden: Over the next decade, a bit over half of revenues will be generated by individual income taxes, when previously this figure averaged 45 percent. Note, however, that the increase in tax revenues from individual income taxes in terms of GDP is mainly due to "bracket creep": The CBO estimates that individual income will grow faster than inflation, pushing more taxpayers into higher tax brackets. If Congress is expected to eventually prevent this shift of individuals and households into higher tax brackets, then revenues should be expected to grow less than projected by the CBO and instead remain close to their historical average of 17.5 percent of GDP.
After a notable surge in 2008-13, defense and other discretionary expenditures as a share of GDP are projected to contract even further over the next decade. In contrast, mandatory outlays—mainly Social Security and health care—are expected to continue to grow. Both these trends have persisted for some time, following a deliberate shift in government policy from expenditures in public goods to transfers. Over the next decade, expenditures for Social Security and health care will average 11.3 percent of GDP (i.e., between a tenth and an eighth of the income generated by the U.S. economy).
Just as deficits are expected to persist, debt is projected to grow. In addition, the CBO expects interest rates to eventually return to historical levels, further contributing to the deficit. Higher interest rates will have a delayed impact on the deficit, however, as the government will still enjoy for some time the low rates at which it is currently issuing long-term debt. Note that even if interest rates were to remain at their current low levels, the deficit would still average around 3 percent of GDP, which is relatively high by historical standards. If, as argued here, tax revenues from individual income do not grow as projected, then the gains from lower interest rates and the losses from lower revenues will roughly net out.
Note
1 Outlays include all forms of government spending (e.g., purchases of goods and services, transfers to individuals and other grants, and interest payments on the debt). The deficit is the difference between outlays and tax revenues. "Debt held by the public" excludes holdings by federal agencies (e.g., the Social Security trust funds) but includes holdings by the Federal Reserve Banks. Each year referred to in this essay is a fiscal year, which runs from Oct. 1 to Sep. 30 and is designated by the year in which it ends. Before 1977, the fiscal year began July 1 and ended June 30.
© 2016, Federal Reserve Bank of St. Louis. The views expressed are those of the author(s) and do not necessarily reflect official positions of the Federal Reserve Bank of St. Louis or the Federal Reserve System.