
Taking Stock: Income Inequality and the Stock Market
Recent economic studies have documented rising income inequality in the United States.1 Which macroeconomic factors have contributed to the long-term increase? Differences in the income compositions of the rich and poor are one potential source for increasing inequality. For example, in a recent study, Chen and Stafford (forthcoming) argue that fewer than 20 percent of households own stock directly. If this 20 percent is concentrated among the wealthy—who have better access to asset markets—they may receive a larger portion of their income from stock options and capital gains, while the poor and middle class may rely primarily on wage and salary income. Thus, as stock prices and capital returns increase, the wealthy might benefit more than other individuals earning income from labor. In this essay, we consider how movements in stock prices and short-term interest rates correlate with trends in U.S. income inequality.
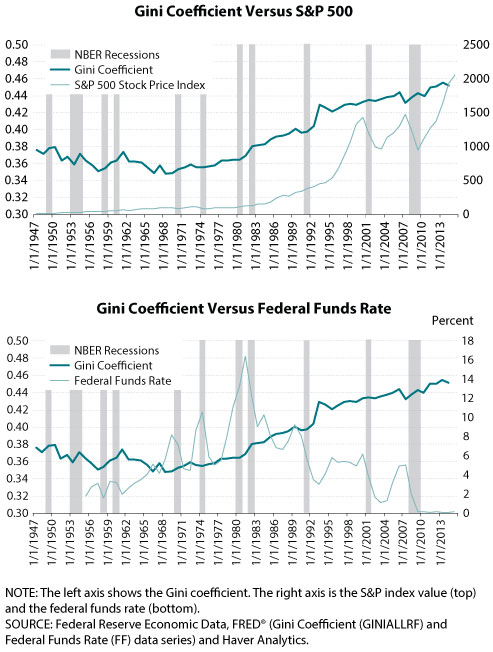
To measure inequality, economists often sort the population by income percentiles and measure the difference across these percentiles. The Gini coefficient is one measure that economists use to summarize inequality across the entire distribution. The Gini coefficient measures income concentration at each percentile of the population and ranges from 0 (perfectly equal) to 1 (perfectly unequal).2 The figures show the Gini coefficient (thick line) during the post-World War II period, along with stock prices (thin line, top figure) and interest rates (thin line, bottom figure).
Before the early 1970s, income inequality in the United States was relatively low—the Gini coefficient was flat or declining. Starting in the 1970s, wage growth at the top of the income distribution outpaced the rest of the distribution and inequality began to rise. The Gini coefficient grew from 0.394 in 1970 to 0.482 in 2013. The Congressional Budget Office (CBO, 2014) estimates that between 1979 and 2011 market income grew 56 percent in the 81st through 99th percentiles, and 174 percent in the remaining top 1 percent.3 In contrast, market income growth averaged 16 percent in the bottom four quintiles. After the 1970s increase, inequality continued to rise. In the 2001 and 2007-09 recessions, top incomes fell sharply as stock market crashes decreased the value of capital gains and stock options. However, losses to top income earners were temporary: During 2009-14, the top 1 percent recaptured 58 percent of income gains that were lost prior to and during 2009.
As the figures show, income inequality does not always move with the business cycle. Recessions tend to have different effects on the income distribution because some cycles are different from others. During the 1970s oil crisis, income inequality did not change. However, recessions associated with financial crises tend to impact income inequality more. In the financial turmoil leading up to the 1920 and 2007-09 recessions, inequality decreased as income earners in the top percentile absorbed more losses than the rest of the distribution. In 1920, unlike 2007-09, these losses were spread over decades as top capital incomes failed to recover.4 Financial crises affect high-income earners disproportionately because of their exposure to riskier assets.
Comparing stock prices with the Gini coefficient provides further evidence of financial movement with income inequality. The steady increase in U.S. income inequality from the 1970s through the early 2000s was accompanied by strong gains in the stock market. The S&P 500 composite index grew from 92 in 1977 to over 1476 in 2007—about a 140 percent increase. These gains were huge. By comparison, the gains in the prior 30 years (1947-77) were only 50 percent. The correlation between the Gini coefficient and stock prices from 1947 to 2013 is strongly positive. As stock prices rise, the gains are disproportionately distributed to the wealthy. Lower- and middle-income families who are also wealth-poor are less likely to expose their savings to the higher risks of equity markets.
If increases in stock market returns primarily benefit the wealthy, it might be reasonable to assume that decreases in the "risk-free" interest rate hurt those with low and middle incomes who have savings accounts or safer asset investments. Low rates on safe assets push individuals toward riskier assets to earn better returns. In turn, this causes the prices of these assets to increase and halts access to high-return products for poorer individuals. However, there is less evidence that rate decreases affect income inequality. The bottom figure shows the Gini coefficient and the effective federal funds rate. In general, there is a slight negative correlation between the Gini coefficient and interest rates, but the trend increase in income inequality begins in the 1970s, about 10 years before rates started their long decline. The Federal Reserve lowers rates in response to economic conditions; thus, low rates actually work to prevent financial damage instead of exacerbating inequality. When the economy recovers, rates rebound and all returns to normal.5
The increase in income inequality in the 1970s was accompanied, in part, by gains in the stock market. Comovement between stock prices and income inequality results from the fact that gains in the stock market tend to benefit those in the wealthiest portion of the income distribution, who have better access to and higher participation in these asset markets. This type of comovement does not translate through to all asset markets, as short-term interest rates appear uncorrelated with rising income inequality. Rates are countercyclical, lowered during downturns in the business cycle and during times of financial stress, making any effect on inequality short-term.
Notes
1 There is a vast literature documenting rising U.S. income inequality. See Owyang and Shell (2016) for a summary of the main methodology and findings within this literature.
2 The Gini coefficient in our analysis is calculated by the Bureau of Labor Statistics using data from the Current Population Survey. Stock prices are the index value of the Standard and Poor's (S&P) 500 composite index, and the federal funds rate is the effective federal funds rate produced by the Board of Governors of the Federal Reserve System.
3 The CBO defines market income as the sum of labor income, business income, capital income, and retirement income.
4 Data for Gini coefficients before 1947 are limited, but Picketty and Saez (2003) examine inequality before and after the Great Depression using tax return data to study the share of top incomes relative to total income.
5 For more information on how monetary policy does and does not affect income inequality, see Bullard (2014).
References
Bullard, James. "Income Inequality and Monetary Policy: A Framework with Answers to Three Questions." Presented at the C. Peter McColough Series on International Economics, Council on Foreign Relations, New York, June 26, 2014; http://research.stlouisfed.org/econ/bullard/pdf/Bullard_CFR_26June2014_Final.pdf.
Chen, Bing and Stafford, Frank P. "Stock Market Participation: Responses Before and During the Great Recession." Forthcoming in Journal of Money, Credit, and Banking.
Congressional Budget Office. "The Distribution of Household Income and Federal Taxes, 2011." November 12, 2014; https://www.cbo.gov/sites/default/files/113th-congress-2013-2014/reports/49440-Distribution-of-Income-and-Taxes.pdf.
Owyang, Michael T. and Shell, Hannah G. "Measuring Trends in Income Inequality." Federal Reserve Bank of St. Louis The Regional Economist, April 2016, 24(2), pp. 4-5; https://www.stlouisfed.org/publications/regional-economist/april-2016/measuring-trends-in-income-inequality.
Piketty, Thomas and Saez, Emmanuel. "Income Inequality in the United States, 1913-1998." Quarterly Journal of Economics, February 2003, 118(1), pp. 1-39; http://eml.berkeley.edu/~saez/pikettyqje.pdf.
© 2016, Federal Reserve Bank of St. Louis. The views expressed are those of the author(s) and do not necessarily reflect official positions of the Federal Reserve Bank of St. Louis or the Federal Reserve System.