
The Deleveraging of U.S. Households Since the Financial Crisis
U.S. households started deleveraging after the Great Recession ended. Credit card debt reached $866 billion in the last quarter of 2008 but then steadily decreased to $660 billion by the first quarter of 2013. During the 2007-10 period, the mean credit card debt of U.S. households decreased 21 percent, from $3,538 to $2,791. Understanding the causes and consequences of this process is part of ongoing research at the Federal Reserve Bank of St. Louis.2 The key question is whether the reduction in consumer debt is due to lenders restricting the credit supply in response to worsening labor market conditions or to consumers reducing credit demand in response to concerns about future income. To shed light on the issue, this essay considers whether household deleveraging between 2007 and 2010 was uniform across education levels and decomposes the data along the extensive margin (how many households borrowed) and the intensive margin (how much households borrowed).

Using data from the Survey of Consumer Finances (SCF), households are divided into four groups according to the education level of the head of household, ranging from high school dropouts to college graduates. The first table shows the mean levels of credit card debt in 2007 and 2010 for all groups and the percentage change between the two years. First, households with more education have, on average, higher mean credit card debt. This higher debt may be due to lenders extending more credit to households with higher incomes, which tend to have more education. Second, the mean level of credit card debt decreased an average of 21 percent from 2010 to 2007 for all groups. This finding is surprising given that U.S. median household income decreased by only 2 percent and personal disposable income increased by about 7 percent during the period.3 Interestingly, the percentage change is fairly large for all groups, ranging from –17.7 percent for high school dropouts to –25.4 percent for high school graduates.

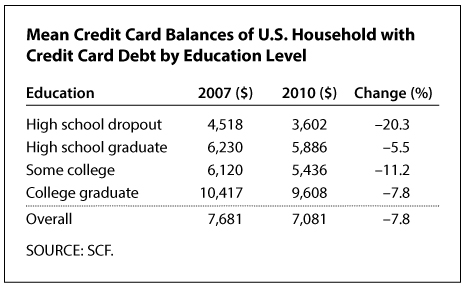
The second table shows the percentages of households with credit card debt. In 2007, 46 percent of households had credit card debt. As the third table shows, the mean credit debt of these households was $7,681, up from $3,538 for all households. In 2007, 27 percent of households headed by a high school dropout held credit card debt, in contrast to more than 50 percent of the households with at least some college. From 2007 to 2010, the percentage of households with credit card debt decreased only for those with a high school education or more. Several differences between the two margins stand out. First, as expected, mean credit card debt is higher at all education levels for households with credit card debt (see the third table) than households overall. Second, for these households, the changes between 2007 and 2010 were more heterogeneous across education levels: The least-educated households decreased their credit card debt by 20 percent, on average, while the most-educated households decreased theirs by only 8 percent.
While households decreased credit card debt between 2007 and 2010, the process varied by education level between households on the extensive margin and intensive margin. For the least-educated households—those headed by a high school dropout—deleveraging occurred only along the intensive margin. During this period, however, the percentage of these households using credit cards actually increased, from 27 to 28 percent. In contrast, for more-educated households, deleveraging occurred in both the intensive and extensive margins: They reduced their outstanding credit card balances and fewer of these households held any credit card debt. These findings suggest that both the supply of credit and the demand for credit affected deleveraging. While a change in the supply of credit helps explain the overall change in credit card debt, it does not explain why the least-educated households actually increased their access to credit during this period.
Notes
1 The author thanks Emircan Yurdagul for excellent research assistance.
2 Athreya et al. (2014).
3 Data are from the U.S. Census Bureau and Bureau of Economic Analysis, respectively.
Reference
Athreya, Kartik; Sánchez, Juan M.; Tam, Xuan S. and Young, Eric R. "Labor Market Upheaval, Default Regulations, and Consumer Debt." Working Paper No. 2014-002A, Federal Reserve Bank of St. Louis, January 2014; http://research.stlouisfed.org/wp/more/2014-002.
© 2014, Federal Reserve Bank of St. Louis. The views expressed are those of the author(s) and do not necessarily reflect official positions of the Federal Reserve Bank of St. Louis or the Federal Reserve System.