
Winners and Losers in the Great Recession
It is well known that the most recent recession resulted in a sharp contraction in national gross domestic product (GDP) and employment. Perhaps less well known are the significant differences in performance across economic sectors. Arithmetically, GDP at the national level equals the sum of value added (that is, GDP) for each business sector, or industry, in the economy.
Data on value added by industry are available at an annual frequency through 2011.1 What do we find if we use these data to group private industries in terms of their performance since the start of the most recent recession? For 2007 to 2011, I define the "winners" as those industries that grew at least 1 percentage point faster than nominal GDP. The "losers" are those industries that grew at least 1 percentage point slower than nominal GDP. I define all remaining industries as "average"—that is, those that grew between 1 and –1 percentage point of nominal GDP.
The winners' group includes agriculture, forestry, fishing, and hunting; mining; utilities; transportation and warehousing; professional, scientific, and technical services; management of companies and enterprises; educational services; and health care and social assistance. The average group includes manufacturing of nondurable goods; finance and insurance; real estate and rental and leasing; administrative and waste management services; arts, entertainment, and recreation; accommodation and food services; and other services, except government. The losers' group includes construction, manufacturing of durable goods, wholesale trade; retail trade; and information. In 2007, prior to the downturn, the winners' group represented 24 percent of total GDP, the average group 35 percent, and the losers' group 28 percent (the remaining 13 percent corresponds to government).
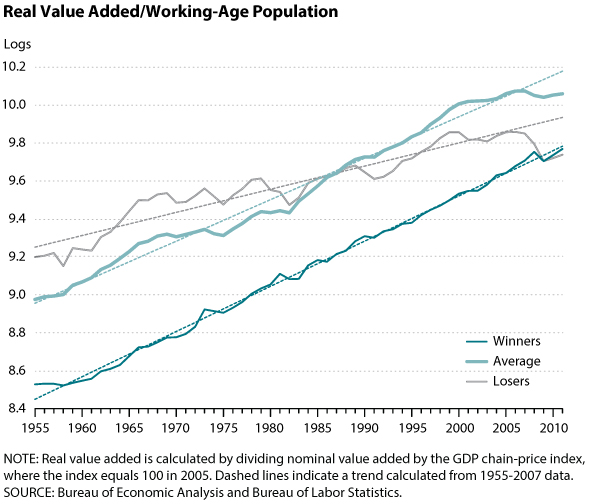
The accompanying chart shows a slightly different comparison for a longer time period, 1955-2011. In the chart, each industry's nominal value added is divided by the chain-price index for GDP (where the index equals 100 in 2005) and by the working-age population.2 The chart also includes an estimate of the pre-recession trend calculated from data for the period 1955-2007 (the dashed lines).
A few facts are immediately apparent. First, prior to the most recent recession, the winners' group grew faster than the average group, which in turn grew faster than the losers' group; respectively, the groups grew by 2.4 percent, 2.2 percent, and 1.2 percent. Second, value added is less volatile for the winners' group than for the average and the losers' groups. Third, the winners' group overall remained at about trend throughout the recession (and afterward), while the other two groups experienced significant and persistent contractions. As of 2011, the average group remained 12 percent below its pre-crisis trend, while the losers' group was 20 percent below.
My analysis suggests that industries comprising the losers' group have been in secular decline, relative to the rest of the economy, for a long time. Between 1955 and 1980, these industries represented, on average, 37 percent of the U.S. economy; by 2007, as mentioned above, this proportion had dropped to 28 percent.
Complementary evidence emerges when we analyze employment data by industry. Prior to the most recent recession, the losers experienced no increase in employment, relative to the trend in the nation's total working-age population. As of 2011, employment in the losers' group was 5 percent below its pre-recession average, mathematically accounting for about 90 percent of the decrease in national employment between 2007 and 2011. The lion's share of the loss is in construction, manufacturing of durable goods, and wholesale and retail trade. Many industries in the average group also experienced lower employment. Employment increases were concentrated in only a few sectors, including health care and, to a lesser extent, education.
In conclusion, for a significant number of industries—representing roughly a quarter of the U.S. economy—the most recent recession has been business as usual when judged by pre-recession trends. For a slightly larger group of industries, mostly related to construction, manufacturing, and trade, the contractions have been severe, reinforcing a preexisting process of steady relative decline.
Notes
1 The Bureau of Economic Analysis computes value-added as "an industry's gross output (sales or receipts and other operating income, commodity taxes, and inventory change) minus its intermediate inputs (consumption of goods and services purchased from other industries or imported)." Note that the sum of the value added for all industries equals GDP.
2 The working-age population equals the civilian noninstitutionalized population 16 to 64 years of age. Data are from the Bureau of Labor Statistics.
© 2013, Federal Reserve Bank of St. Louis. The views expressed are those of the author(s) and do not necessarily reflect official positions of the Federal Reserve Bank of St. Louis or the Federal Reserve System.