
The Mysterious Greek Yield Curve
A yield curve is a graph of interest rates for bonds with similar risk characteristics but differing maturities. Yield curves usually slope upward—rates on long-term bonds are higher than rates on short-term instruments. Sometimes yield curves slope downward, a phenomenon that often predicts recession.1 The charts show that the yield curve for Greek government debt has recently developed a pronounced hump-shaped pattern.

What economic conditions cause this very unusual shape? Expectations of debt restructuring are the likely culprit. In one widely expected program, Greece's creditors would accept a large reduction in their bond payoffs in exchange for a lower likelihood of outright default and preferential treatment in the event of further restructuring.2 Under such a plan, every bond redeemed after the restructuring date would be redeemed for only half its original face value.
To understand how the expected restructuring produces the hump in the yield curve, one needs to understand the relation between bond prices, payoffs, and yields.3 The payoff on a bond is usually considered a fixed term of the contract. The bond price is determined in the market. The bond yield is the interest rate that discounts the nominal bond payoff to equal its market price. A yield for an M-year bond is defined by
Rearranging terms, the M-year yield can be expressed as follows:
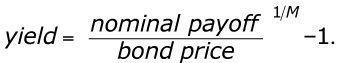
Other things equal, a lower bond payoff will reduce bond prices proportionately. That is, if markets expect 50 percent lower payoffs for bonds that mature in more than six months, the prices of those bonds will fall by 50 percent.
The hump in the Greek yield curve exists because the calculated yields assume that the bonds will pay off at their full value but market prices incorporate expectations that the payoff will be much lower. To see this, let's consider a numerical example: A hypothetical 2-year bond with a nominal payoff of 100 euros and a price of 80 euros would have an implied yield of 11.8 percent. If markets suddenly expect that the payoff will be cut in half, to 50 euros, the bond price will fall to 40 euros. But if the yield is calculated with the nominal payoff of 100 euros—rather than the expected payoff—the new price of 40 euros will imply a 58.1 percent yield! At longer time horizons, however, the implied yield is less sensitive to the reduced payoff, and so longer yields will not rise as much. For example, expectations of a 50 percent reduction in payoffs would increase the yield on a hypothetical 10-year bond from 11.8 percent to only 19.8 percent. Yields for bonds that mature before the expected restructuring are unaffected, of course. Thus, there is a hump around the expected date of restructuring.
The second chart illustrates the effect of the voluntary restructuring by recalculating the Greek yield curve (dashed line) as of January 26, 2012, after assuming that bond prices for maturities longer than six months were twice the observed market prices—that is, not subject to a restructuring deal—but the nominal payoffs remained unchanged.
Notes
1 See Neely, Christopher J. "What Is the Slope of the Yield Curve Telling Us?" Federal Reserve Bank of St. Louis Monetary Trends, August 2000; http://research.stlouisfed.org/publications/mt/200....
2 See Gulati, G. Mitu and Zettelmeyer, Jeromin. "Making a Voluntary Greek Debt Exchange Work." Capital Markets Law Journal (forthcoming).
3 These calculations assume zero coupon bonds and annually compounded interest rates for simplicity. Actual conventions in bond markets are much more complex.
© 2012, Federal Reserve Bank of St. Louis. The views expressed are those of the author(s) and do not necessarily reflect official positions of the Federal Reserve Bank of St. Louis or the Federal Reserve System.