
The Federal Debt: What’s the Source of the Increase in Spending?
In a recent Economic Synopses essay, we investigated whether the rise in the federal debt over the past 60 years was the result of declining revenue, increased expenditures, or some combination of the two. We found that "the rise in the national debt…is entirely a consequence of the federal government's increase of expenditures without an offsetting increase in revenues." We found a marked increase in government spending beginning in 1975 that was not matched by a corresponding increase in government revenue. Specifically, on average, government spending increased by 2.5 percent of GDP over the period 1975-2007 compared with the period 1960-74, while revenue increased by only 0.6 percent of GDP. In this essay we investigate the source of the marked increase over this period.

The first chart shows the five primary categories of government spending since 1950—defense, interest on the public debt (IPD), Social Security and Medicare (SSM), other payments to individuals (OPI), and other federal expenditures (OFE). The chart shows that, with the exception of expenditures for the Korean War, defense spending as a percent of GDP has generally trended lower since World War II. After surging from about 6 percent in 1950 to about 15 percent in 1953, defense spending subsequently declined sharply to a little more than 3 percent in the early 2000s. The secular decline in defense spending was interrupted briefly in the 1960s and early to mid 1980s because of the Vietnam War and the so-called Reagan defense build-up. Since then, defense spending has increased to about 5 percent of GDP because of the wars in Iraq and Afghanistan.
By contrast, IPD has been relatively flat since 1950, averaging 1.5 percent over the period 1950-80 and 1.7 percent over the period 2000-2010. There was a relatively brief rise in IPD from the late 1970s to the mid 1990s that reflected two developments. First, long-term nominal interest rates rose from an average of about 7.75 percent for 1974-78 to an average of about 11.75 percent for 1979-85. Second, as we noted in our previous essay, public debt as a share of GDP roughly doubled from the early 1980s to the mid 1990s, from about 35 percent of GDP to about 70 percent.1
With the exception of the rise in the 1980s and 1990s, when it reached a peak of a little over 3 percent of GDP, OFE trended up during the period 1950-80, reaching a peak of 4.5 percent of GDP in 1978. Since the early 1990s, OFE, which is mostly non-defense discretionary spending, has been relatively stable, averaging 2.0 percent of GDP over the period 1992-2010.
The chart indicates that there are two categories of federal spending that have increased as a share of GDP since 1950: SSM and OPI. This spending, which is mostly mandatory outlays not subject to annual budgetary appropriations, have become the federal government's largest budgetary commitment. Social Security and Medicare spending experienced its largest increase from 1950 to 1983, when its share rose from 0.3 percent of GDP to 6.5 percent. SSM outlays continued to rise thereafter, but more slowly, reaching 7.3 percent of GDP in 2007. Indeed, from 1983 to 1989, SSM outlays as a percent of GDP declined from 6.5 to 6 percent. The second major programmatic category, OPI, was relatively constant from the early 1950s to the early 1970s. OPI moved temporarily higher in the aftermath of World War II, reaching 4.7 percent of GDP in 1950; it then began to trend lower and remained relatively constant at 2.7 percent of GDP between 1951 and 1974. Other payments to individuals subsequently moved modestly higher over the following 30 years or so. Although OPI outlays also temporarily declined from 5 percent of GDP to 3.9 percent during the 1983-90 business expansion, this spending nonetheless ticked higher over time, rising to an average of about 4.75 percent from 1975 to 2007. Not surprisingly, both of these categories of expenditures increased significantly during the past three years. This increase, relatively large from an historical standpoint, reflected the sharp decline in real GDP during the recession, the subsequent weaker-than-normal recovery, and the non-cyclically sensitive nature of this spending. Combined, SSM and OPI accounted for nearly 70 percent of total government spending in 2010.
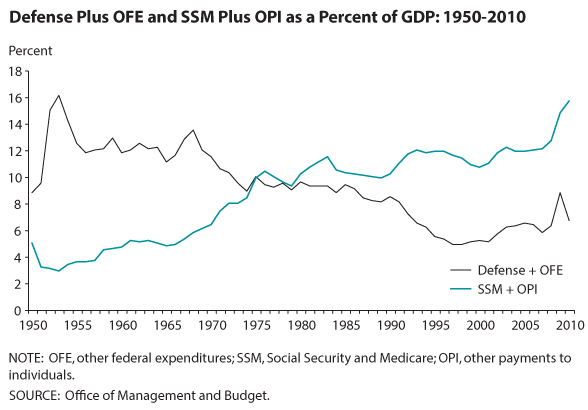
All of the increase in government spending that we documented previously is due to increases in SSM and OPI. This is shown clearly in the second chart, which tracks defense plus OFE and SSM plus OPI over the period 1950-2010. Defense plus OFE trends down over the period, while SSM plus OPI trends up. The two are essentially equal in 1975. Over the period 1950-1975, defense plus OFE and SSM plus OPI averaged 11.9 and 5.1 percent of GDP, respectively. From 1975 through 2007, the averages are 7.5 percent and 11.0 percent, respectively. Hence, the decline in discretionary defense and OFE spending, 4.4 percent, was not sufficient to offset the increase in mandatory SSM and OPI spending, 5.8 percent, so that total spending increased by 1.4 percent of GDP.
This analysis suggests that the increase in the debt over the period 1975-2007 was not only a consequence of increased government spending without increased revenues, but also that the government increased payments to individuals through Social Security, Medicare, and other payments without sufficiently reducing spending elsewhere in the budget. In short, these trends, as the CBO's recent Long-Term Budget Outlook makes clear, will continue to strain federal, state, and local budgets as they consume an ever larger percentage of federal spending dollars.
Note
1 According to the "Alternative Fiscal Scenario" outlined in the Congressional Budget Office's recent Long-Term Budget Outlook, net interest expenditures are projected to rise to 43 percent of GDP in 2085. This scenario assumes that revenues remain at roughly its historical levels (about 18 percent of GDP), but that non-interest outlays rise from about 23 percent of GDP in 2011 to about 33 percent of GDP in 2085.
© 2011, Federal Reserve Bank of St. Louis. The views expressed are those of the author(s) and do not necessarily reflect official positions of the Federal Reserve Bank of St. Louis or the Federal Reserve System.