The Evolving Size Distribution of Banks
Fundamental issues about bank size and the systemic risk implications of so-called too-big-to fail policies are heated topics of discussion for researchers, policymakers, and the press alike.1 However, significant changes in size distribution of banks have been occurring since at least the 1980s and 1990s, when the structure of the banking industry began to evolve following regulatory changes such as the Riegle-Neal Interstate Banking and Branching Efficiency Act of 1994 and the Gramm-Leach-Bliley Financial Services Modernization Act of 1999.
To document the changes in the size distribution of banks, we study total assets of commercial banks using the public Call Reports for three selected dates: 1987:Q2, 1998:Q2, and 2009:Q2.2 During these 22 years the number of banks fell from 15,168 to 10,169 and then to 7,744 after progressive concentration of the industry and bank failures, particularly during the Savings and Loan Crisis of the late 1980s and early 1990s and the current financial crisis.
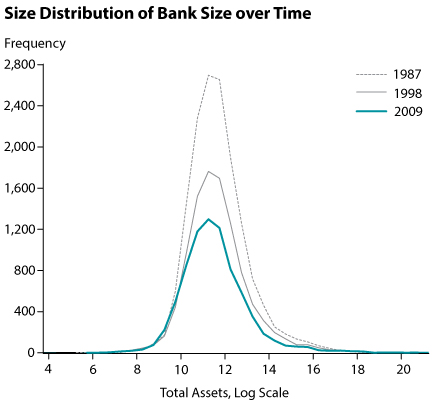
We can use total assets at the end of these three quarters to compare the distribution over time. We deflate each bank's assets and then rescale them, dividing by the total assets each year relative to 2005. The chart plots the distribution using the logarithm of assets on the horizontal axis and the frequency on the vertical axis. Each curve represents the bank size distribution for one of the three study years.
Many key facts can be noticed using this chart. First, the total number of banks in the United States has substantially decreased, although the number is still considered large by international standards. Second, over time the increase in the number of relatively larger banks stretched the tail of the distribution to the right, a common measure of the asymmetry of a distribution around its mean—the skewness of the distribution—increased from 0.92 in 1987 to 0.95 in 2009. Third, the largest banks own an even larger share of total assets, making the right tail of the distribution even thicker, a measure of the thickness of a distribution tail—the kurtosis—has increased from 5.4 in 1987 to 6.7 in 2009. If we dropped the largest 50 banks, the kurtosis would increase by much less and the skewness would fall instead of increasing.

Hence, the flattening of the bank size distribution is part of a long-term trend and may have led to a more concentrated industry with larger average-size and big banks independently of the recent financial crisis and the concurrent policy interventions. The current debate on too big to fail is important because it clarifies the tension between profitability, propensity to take risk, economies of scale, and economies of diversification on the one hand, and the competitive and systemic risks imposed by fewer larger yet more complex players on the other hand. However, if limiting the size of large banks were considered appropriate to reduce systemic risk, it would be a clear change of direction relative to the long-term evolution of the industry.
Notes
1 Bullard, James. "The Fed and the Coming Redefinition of Government Regulation." Presented at the Business Today International Conference: "Weathering the Storm: The Challenges and Opportunities of a Global Slowdown," New York, November 22, 2009; http://research.stlouisfed.org/econ/bullard/BullardPrincetonFINAL.pdf.
2 For a more extensive analysis of the changes in the size distribution, see Janicki, Hubert P. and Prescott, Edward S. "Changes in the Size Distribution of U.S. Banks: 1960-2005." Federal Reserve Bank of Richmond Economic Quarterly, Fall 2006, 92(4), pp. 291-316; www.richmondfed.org/publicatio... janicki_prescott.pdf.
© 2010, Federal Reserve Bank of St. Louis. The views expressed are those of the author(s) and do not necessarily reflect official positions of the Federal Reserve Bank of St. Louis or the Federal Reserve System.


 follow @stlouisfed