Home > Tracking the Global Recession
|
Track the Economic Indicators |
|
Track the GDP Data |
|
Business Cycles Dates |
|
|
|
PDF version of charts and data references.
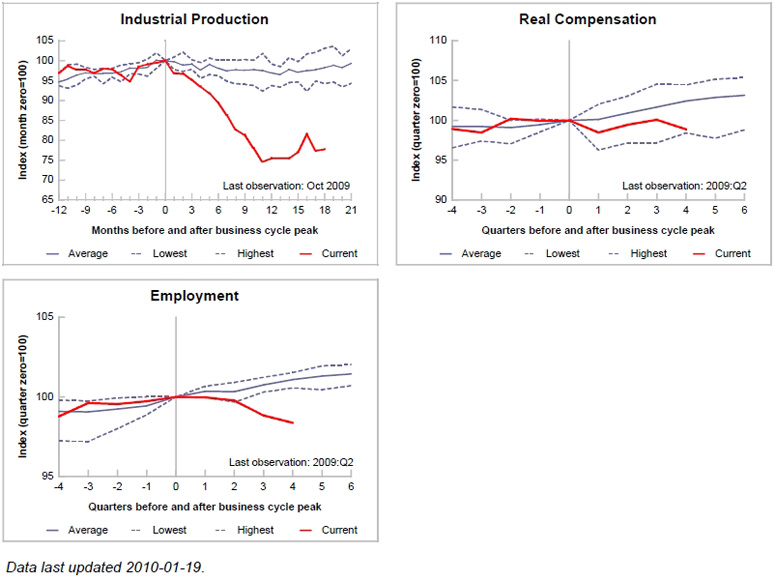
NOTE: The charts plot three main economic indicators similar to those tracked by
the NBER dating committee for the U.S.; each series is indexed to 100 at the business cycle peak. The red line indicates
the current recession.
The solid blue line indicates the average of the previous six
recessions, starting with the September 1984 peak. The two dashed lines report the highest and lowest values recorded across these previous recessions.
|
The data and recession dates used in the charts are from the Organisation for Economic Co-Operation and Development (OECD). The following data series
are used to create the charts above:
- Industrial Production
- Industry Excluding Construction
- Real Compensation
- Compensation of Employees
- deflated by the Price Index for Private Consumption
- Civilian Employment
SOURCE: Main Economic Indicators and Quarterly National Accounts, © Organisation for Economic Co-Operation and Development (OECD),
<http://www.oecd.org>.
|
