Home > Tracking the Global Recession
|
Track the Economic Indicators |
|
Track the GDP Data |
|
Business Cycles Dates |
|
|
|
PDF version of charts and data references.
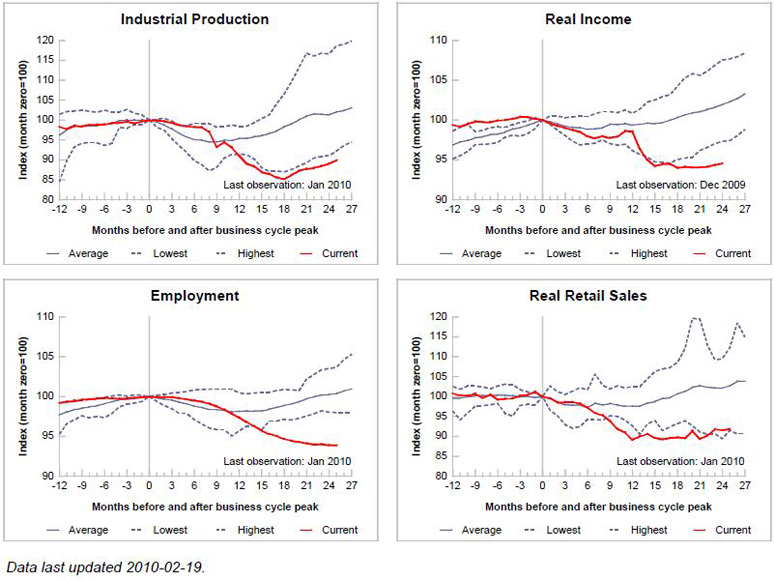
NOTE: The charts plot four main economic indicators tracked by the NBER dating committee; each series is indexed to
100 at the start of the recession. For industrial production, employment, and real retail sales, the average series includes
the 10 recessions starting with the November 1948 business cycle peak. For real income, the average starts with the
April 1960 peak. For additional information, see the Federal Reserve Bank of St. Louis Economic Synopses, 2009, No. 4.
|
The following FRED® data series are used to create the charts above:
Create your own recession charts using FRED® Graph or .xls templates.
|
