
Real Wage Growth at the Micro Level
Abstract
This article investigates patterns in real wage growth in 2022 to determine whether wages have kept up with rising price levels and how this differs among labor market participants. Using the consumer price index for wages and imputing expenditure data from the Consumer Expenditure Survey, we separately measure nominal wage growth and inflation rates at the micro level. We find that there is more heterogeneity in the former, meaning that when we combine them, an individual's real wage growth is primarily driven by their nominal wage growth. In 2022, 57 percent of individuals experienced negative real wage growth, with older and less-educated workers, as well as job stayers, being hit the hardest. Conversely, younger and highly educated workers, as well as job switchers, had higher real wage growth.
Victoria Gregory is an economist and Elisabeth Harding is a research associate at the Federal Reserve Bank of St. Louis.
INTRODUCTION
Until the beginning of 2021, the past decade saw consistent positive year-over-year real wage growth, showing that wage growth outpaced the rising cost of living. However, in the past two years, the U.S. has experienced high inflation combined with strong wage growth. With aggregate inflation reaching a high of 9 percent in June 2022 and average nominal wage growth soaring to 6.4 percent in 2022, most households experienced both rising wages and rising cost of living. The difference between these two values determines real wage growth. However, the contributions of these components may differ across individuals or households. The unequal impact of inflation across age, education, household size, and income is of great interest to policymakers.
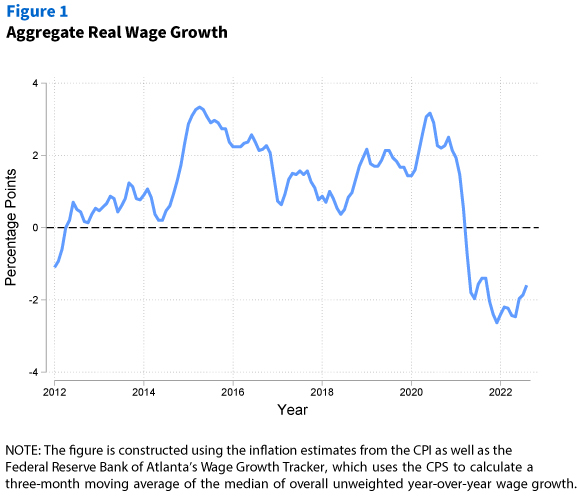
To illustrate these trends, Figure 1 depicts median real wage growth in the United States over the past decade. The figure shows that while workers saw increases in real wage growth in 2015 and 2020, it typically ranged from 1 percent to 3 percent until 2021. However, more recently, median real wage growth has hovered around –2 percent, indicating a notable shift in economic conditions.
In this article, we explore the heterogeneity behind the negative values shown in Figure 1 by analyzing the distribution of real wage growth in 2022 across households. Specifically, we examine nominal wage growth and inflation rates at the individual level to determine the real wage growth rates for each worker in our sample. However, measuring real wage growth at the individual level presents a challenge. To calculate individual real wages, we must observe both wage and consumption for each individual, but there are no current microdata that cover both consumption and nominal wage growth.
We overcome this challenge by combining consumption data from the Consumer Expenditure Survey (CEX) and wage growth data from the Current Population Survey (CPS). We begin by pinpointing individuals in the CPS for whom we can observe wages 12 months apart. The CPS records wage information for individuals as they rotate out of the survey. We then follow the methodology of the Federal Reserve Bank of Atlanta's Wage Growth Tracker to measure median nominal wage growth, finding that the distribution of nominal wage growth has a wide range, with most values between –50 percent and 50 percent.
Rather than use the Bureau of Labor Statistics's (BLS) measure of average inflation, we calculate individual inflation rates that account for differences in consumption patterns of different demographic groups. We impute consumption information from the CEX to the CPS based on demographic characteristics: age, education, income, and household size. This imputation estimates consumption baskets for our sample of individuals in the CPS, thus providing us with a data set of observed wage and imputed consumption. To measure inflation, we match the consumer price index (CPI) inflation series to our 19 CEX expenditure categories to calculate individual inflation rates based on the estimated consumption baskets. Unlike that of nominal wage growth, the distribution of inflation rates has a narrow range, from 7 percent to 13 percent for most individuals.
Last, we calculate individual real wage growth as the difference between an individual's nominal wage growth and inflation rate and analyze real wage growth across demographic groups. Our results highlight three important features of real wage growth in 2022. First, 57 percent of individuals experienced negative real wage growth, 10 to 15 percentage points higher than in typical years. Second, real wage growth varies significantly across demographic groups. Younger workers as well as individuals who switched jobs experienced the highest real wage growth. The wage of workers older than 55 and individuals with children in the household were least likely to keep up with their rising cost of living. Third, the distributions of nominal wage growth and inflation suggest that variations in real wage growth are driven by variations in nominal wage growth. This observation stems from the fact that we find a lot more heterogeneity in nominal wage growth compared with inflation across households.
This article contributes to several aspects of existing literature. Similar to Argente and Lee (2021) and Kaplan and Schulhofer-Wohl (2017), we study differences in the cost of living across households. While these papers incorporate more sources of these differences that we cannot account for here (such as differences in shopping behavior and quality of items consumed), we explore the connection with wage growth. In addition, they also use the Nielsen Consumer Panel and Retail Scanner data sets, which focus primarily on grocery stores and drug stores. In contrast, we incorporate a much larger set of goods and services using the CEX.
Accordingly, we also borrow some techniques from other papers that use the CEX micro data to study household consumption baskets. For instance, Hobijn and Lagakos (2003) examine inflation inequality across the U.S. from 1987 to 2001 using consumption data from the CEX and aggregating expenditures into 19 categories to best match the CPI series, as we do here. Cravino, Lan, and Levchenko (2018) also use the CEX to document the relative prices of goods consumed across households, but they aggregate households into income percentiles and examine the distributional effects of monetary policy shocks on those consumption baskets. Several other papers also perform related, but different, imputation techniques to link consumption data with other micro data sources, such as Blunder, Pistaferri, and Preston (2008) and Pretnar (2022).
Finally, our work relates to studies examining the characteristics of the income growth distribution, such as Guvenen et al. (2015). We find that the distributions we recover in this article exhibit similar properties.
Read the full article.