Are Unemployment Data Revisions Biased?
by Michael T. Owyang and E. Katarina Vermann
How is payroll employment calculated and revised?
One of the most commonly cited data points regarding employment is the nonfarm payroll employment information compiled by the Bureau of Labor Statistics (BLS).
Nonfarm payroll employment data is:
1. compiled from multi-industry, firm-level survey responses
2. considered preliminary
3. revised once or even twice in the following months as more-accurate data emerge
4. often used to set Fed policy which, according to academic research can move asset prices
Is there systematic bias in the revision method?
If the initial release of payroll employment data is to be viewed as a good forecast of the true employment figure, the data should be unbiased. In other words, the initial releases may vary from the revised releases, but those deviations (some on the high side and some on the low side) should average out to zero over time. This condition applies especially to periods of expansion and recession, and so we examine the revisions to the initial release during those periods to check for any bias. Specifically, we consider the distributions of the first revision to nonfarm payroll employment starting in January 1980. The first chart below plots the unconditional distribution of those revisions. While there are a few large outliers, the distribution appears normal, with a mean of 12.7, which shows that the initial numbers underestimate the change in employment by an average of 12,700 jobs.
The second and third charts below show the distributions of the revisions during periods of expansion and recession, respectively. During expansions, the distribution appears normal but is centered around 18.1, implying that the initial numbers during expansions, on average, underestimate the change in employment by 18,100 jobs. Unlike the distribution in the first two charts, the distribution in the third chart is dramatically different, with a mean of –20.8, implying that during a recession, the initial employment numbers are likely to be overestimated by approximately 20,800 jobs. 1

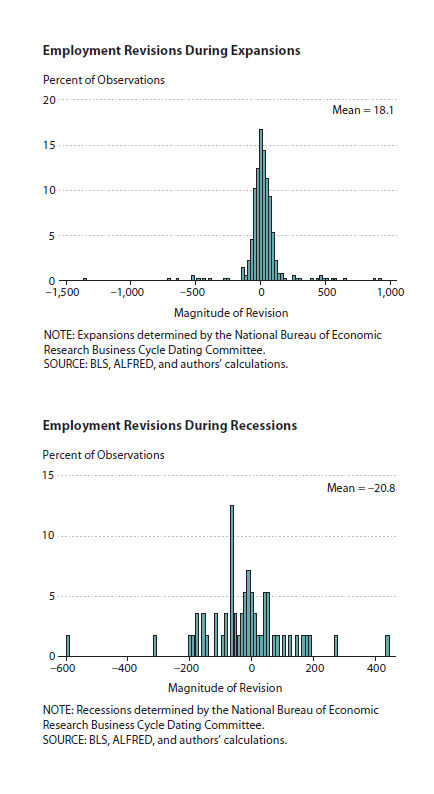
While these simple “eyeball” comparisons are by no means definitive, they do suggest there may be a small but potentially important systematic bias in the revisions of the nonfarm payroll employment data, and it could affect how policymakers use these data to set policy. For example, suppose that the revisions to the payroll employment release during recessions are lower than the initial release. In this case, policymakers might use this information to lower their short-term interest rate target more aggressively to stimulate the economy.
During expansions, the opposite would be true for the revisions (especially soon after the end of a recession) are systematically positive (higher than the release). In this case, the economy might be growing faster than portrayed by the initial release, leading policymakers to set interest rates that are too stimulative. In short, revisions to the monthly payroll employment estimates may be useful guides to the near-term strength or weakness of the economy, but should be considered within the context of overall economic conditions.
NOTE
1 Our calculations were performed without accounting for the annual benchmark revisions that occur in April. As such, the April release can cause large revisions. For example, 19 of 23 large revisions with a magnitude greater than 300 jobs (83 percent) occur in April. When the April revisions are excluded from our analysis, the unconditional mean of the revisions is 10.5, the mean of the revisions during expansions is 16.0, and the mean of the revisions during recessions is –24.7.
The preliminary nature of the data and any systematic bias—or pattern—could affect how policymakers use these data to set policy.
