
The Recent Boom in House Prices: Why Is This Time Different?
The Federal Open Market Committee views housing market improvements as an important condition for recovery of the overall economy. In recent years, the Committee has pursued a very active monetary policy to support mortgage markets by purchasing mortgage-backed securities, thereby exerting downward pressure on long-term interest rates. Low mortgage rates and extensive credit should provide the proper conditions for renters or investors to purchase new or existing houses from the large inventory of unsold houses. The increased demand for residential housing would put upward pressure on house prices and stimulate consumption spending. Higher house prices would also allow some underwater borrowers to refinance their loans with better terms.
House prices have been appreciating across U.S. cities since 2012. Traditionally, rapid appreciation has been localized in areas with rapid economic growth and/or migratory flows. This time, things appear to be different. According to the Zillow Home Value Index, house prices have risen in many areas with slow growth (i.e., Detroit or Memphis). This essay analyzes the recent housing boom and explains why this episode differs from previous ones.
A simple way to dissect the recent housing boom is to summarize the movements in house prices across representative U.S. cities or, more precisely, metropolitan statistical areas (MSAs). The first column in the first chart shows the appreciation of the composite index for the 2012:Q1–2013:Q1 period. The other columns show the appreciation across low, middle, and high market tiers. The median house price for each city is also listed.
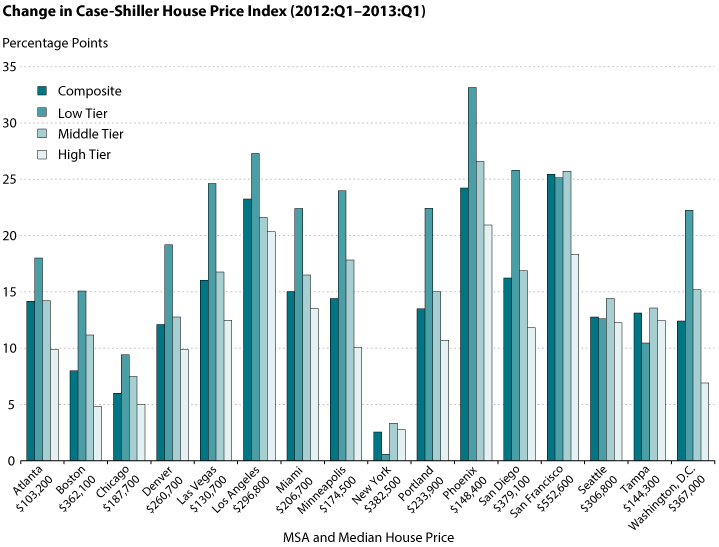
The first chart highlights some important features of the housing boom. First, the boom was relatively uniform across the country. Second, most cities experienced significant appreciation, ranging from 5 percent to 25 percent. Interestingly, some cities with the largest house price declines during the 2007-09 financial crisis (e.g., Las Vegas, Los Angeles, Phoenix, and San Diego) appear to be leading the recovery. The argument could be made that the low house prices eventually made them attractive to buyers, but improvements in the local economy could be the major driver in some of these markets. Also of interest is that the greatest appreciation across all cities occurred in the low tier of homes. Traditionally, this is the niche market for "first-time buyers."
The two largest housing booms in recent history (post-World War II and the 2000s) were fueled by price increases in the low-tier market segment. Both booms were partially driven by improved lending conditions that resulted in a boom in home prices and homeownership—not only in starter homes, but also in other submarkets. The underlying driver of the current boom seems to be different.
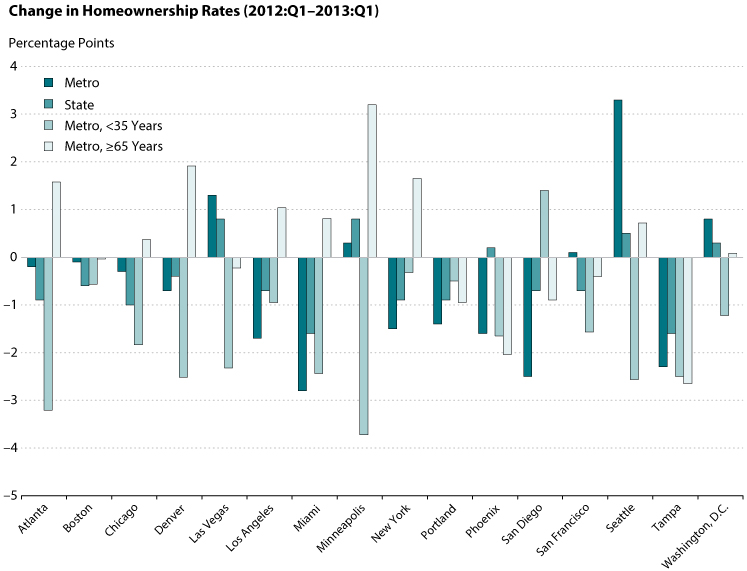
The second chart shows changes in homeownership rates across different metro areas and at the state level during the same period. The homeownership rate, defined as owner-occupied housing units divided by total occupied housing units, declined across the majority of MSAs (with two exceptions: Seattle and Washington, D.C.) and at the state level. As the chart shows, the homeownership rate for individuals 35 years of age or younger declined across all MSAs. The homeownership rate increased only for individuals 65 years or age and older. In contrast, the homeownership rate increased for all age groups during the housing booms in the immediate postwar years and the 2000s.
The combination of the uniform decline in homeownership across most age groups—particularly first-time buyers—and increasing home prices across all tiers suggests private and institutional investors have been profiting from current mortgage market conditions. Since 2006, the national homeownership rate has declined from 69 percent to 65 percent. This shift from owner-occupied to tenant-occupied housing has increased rental prices across all cities. The increased rental prices and the expectation of future capital gains have encouraged investors to purchase single-family homes in the low and middle tiers and generated a new housing boom. These observations suggest the current housing boom is the first nationwide boom since the postwar era not driven by increased demand for owner-occupied housing. The current episode could solidify the idea that housing booms can be driven entirely by investors.
© 2013, Federal Reserve Bank of St. Louis. The views expressed are those of the author(s) and do not necessarily reflect official positions of the Federal Reserve Bank of St. Louis or the Federal Reserve System.