
What To Know About the Rise of Services
The reallocation of economic activity away from manufacturing toward the services sector is a notable feature of advanced economies over the past 40 years. This essay presents four facts about the rise of services in the U.S. and other advanced economies.
1. Value Added: The services sector produces 79% of U.S. output
The services share in value added has grown markedly in the U.S., increasing from 52% in 1950, to 62% in 1980, to 79% in 2020.1 This growth stems from both an increase in the quantity of services produced and the relative price of services. Administrative services; professional services; education; health care; finance and insurance; and arts, entertainment, and recreation industries grew the most since 1980. These six industries now account for more than 33% of the aggregate value added.
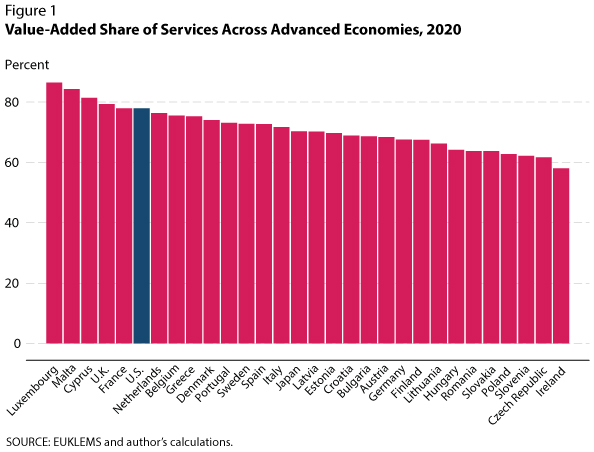
Figure 1 shows that the services sector accounts for more than two-thirds of economic activity in most advanced economies, with the sector's share rising close to 9 percentage points on average over the past 25 years. Professional and administrative services, health care, real estate, and the information industries have driven this increase.
2. Employment and Hours Worked: The services sector accounts for 85% of U.S. employment
In 1980, the services sector employed two workers for every worker in non-service industries in the U.S. It is now 5.5 workers for every non-service worker (i.e., 85% of employment). Skill-intensive industries, such as professional services, health care, and education, grew considerably over the past 40 years and now account for 26% of employment in the U.S. Less-skill-intensive service industries also contributed to this shift in employment: Administrative services, accommodation and food services, and transportation and warehousing now represent 24% of employment in the U.S.
Despite having more people working in services, the average number of hours worked per employed person has declined. Partly due to more part-time jobs in services, the average number of hours worked fell from 1,932 hours in 1980 to 1,587 in 2020. Conversely, the average number of hours worked in non-service industries has been stable at 2,400 hours per year.
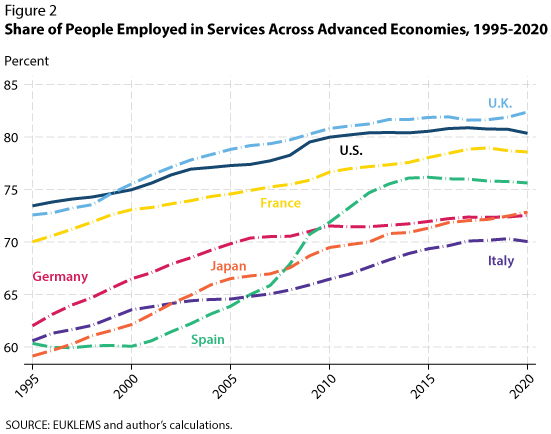
Figure 2 shows that other advanced economies experienced similar growth in services employment: This sector now employs more than two-thirds of workers in industrialized countries. Employment grew the most in professional and administrative services, health care, real estate, and information. People employed in services work fewer hours than non-service workers, with the average for service workers ranging from 1,345 hours per year in Germany to 1,989 hours in Portugal.
3. Firms and Establishments: The services sector accounts for 83% of U.S. firms
Although the number of firms and establishments increased at a slower pace than output and employment in services over the past 40 years, the sector currently comprises 83% of firms and 86% of establishments in the U.S.: There were about four service firms for each non-service firm in 1980 and about five in 2020.2 A rapid expansion of the number of firms in professional services, administrative services, health care, and accommodation and food services drove this increase. These four industries now account for 39% of firms in the U.S.
Most European countries have followed similar trends, with more than two-thirds of firms operating in the services sector. Countries such as Greece, Luxembourg, Netherlands, and Portugal have more than five service firms per non-service firm, while countries such as Germany, Ireland, and Switzerland had fewer than 3.5 service firms. The latter group of countries have many firms in construction and manufacturing.
4. Consumption: The services sector accounts for 78% of U.S. household spending
Household spending represented 78% of personal consumption expenditures in the U.S. in 2020—an 8-percentage-point increase relative to 1980. The increase in spending on services is less spectacular than that in value added over the past 40 years because the measures discussed above relate to production and do not necessarily align with the classification of what final consumers buy.3
Why Did the Services Sector Grow?
Stronger productivity growth in non-service industries (e.g., manufacturing) reduced the cost, and therefore the price, of manufactured goods compared with services. Holding other things constant, this stronger productivity growth in non-service industries tends to increase the share of services in the economy. Another explanation relates to household preferences. As people become richer, they tend to spend less on basic goods and demand more services.
Notes
1 In national accounts, value added refers to the value of the aggregate output of goods and services (i.e., gross output) minus the aggregate expenses with intermediate inputs.
2 Establishments refer to a single, fixed physical location where economic activity occurs. A firm can be an establishment or a combination of establishments.
3 Take a toy as an example. In terms of final consumption, a toy is a good and hence will not be measured as a service output. However, in terms of value added, the toy would be broken down into several components—one related to the production of the toy (i.e., manufacturing), another related to the transportation and storage of toys (a service), and yet another related to its sale in a retail store (a service).
© 2024, Federal Reserve Bank of St. Louis. The views expressed are those of the author(s) and do not necessarily reflect official positions of the Federal Reserve Bank of St. Louis or the Federal Reserve System.