FRED Graph

Your trusted data source
since 1991.
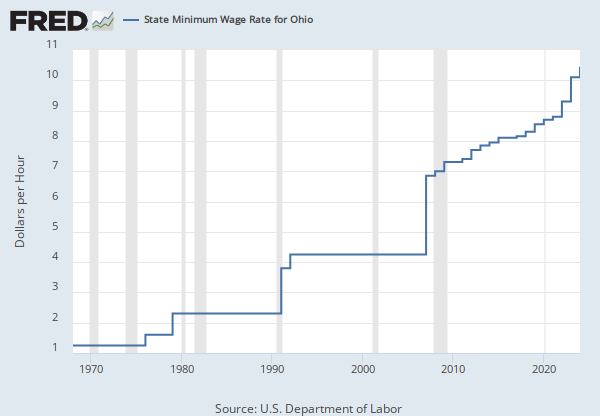
Source: U.S. Department of Labor
Release: Minimum Wage Rates
Units:
Frequency:
The federal minimum wage is the minimum hourly wage employers are required to pay employees who are eligible under the Fair Labor Standards Act (FLSA) of 1938. The FLSA was generally only applicable to employees involved in interstate commerce, either directly or through the creation of goods. Many amendments have since been added to the FLSA, expanding its coverage and raising the minimum wage. Significant amendments occurred in 1961 and in 1966, when a separate minimum wage for farm workers was established. Starting in January of 1978 the minimum wages of all eligible workers, including farm workers, were made uniform. The values in the series for non-farm workers are those for the groups initially covered under the 1938 FLSA. Many states also have minimum wage laws. Some state laws provide greater employee protections; employers must comply with both.
For additional information go to: http://www.dol.gov/whd/minwage/coverage.htm or http://www.dol.gov/whd/minwage/chart.htm#fn3
U.S. Department of Labor, Federal Minimum Hourly Wage for Nonfarm Workers for the United States [FEDMINNFRWG], retrieved from FRED, Federal Reserve Bank of St. Louis; https://fred.stlouisfed.org/series/FEDMINNFRWG, May 14, 2024.
Source: U.S. Bureau of Labor Statistics
Release: Consumer Price Index
Units:
Frequency:
The Consumer Price Index for All Urban Consumers: All Items (CPIAUCSL) is a price index of a basket of goods and services paid by urban consumers. Percent changes in the price index measure the inflation rate between any two time periods. The most common inflation metric is the percent change from one year ago. It can also represent the buying habits of urban consumers. This particular index includes roughly 88 percent of the total population, accounting for wage earners, clerical workers, technical workers, self-employed, short-term workers, unemployed, retirees, and those not in the labor force.
The CPIs are based on prices for food, clothing, shelter, and fuels; transportation fares; service fees (e.g., water and sewer service); and sales taxes. Prices are collected monthly from about 4,000 housing units and approximately 26,000 retail establishments across 87 urban areas. To calculate the index, price changes are averaged with weights representing their importance in the spending of the particular group. The index measures price changes (as a percent change) from a predetermined reference date. In addition to the original unadjusted index distributed, the Bureau of Labor Statistics also releases a seasonally adjusted index. The unadjusted series reflects all factors that may influence a change in prices. However, it can be very useful to look at the seasonally adjusted CPI, which removes the effects of seasonal changes, such as weather, school year, production cycles, and holidays.
The CPI can be used to recognize periods of inflation and deflation. Significant increases in the CPI within a short time frame might indicate a period of inflation, and significant decreases in CPI within a short time frame might indicate a period of deflation. However, because the CPI includes volatile food and oil prices, it might not be a reliable measure of inflationary and deflationary periods. For a more accurate detection, the core CPI (CPILFESL) is often used. When using the CPI, please note that it is not applicable to all consumers and should not be used to determine relative living costs. Additionally, the CPI is a statistical measure vulnerable to sampling error since it is based on a sample of prices and not the complete average.
For more information on the consumer price indexes, see:
Bureau of Economic Analysis. "CPI Detailed Report." 2013.
Handbook of Methods
Understanding the CPI: Frequently Asked Questions
U.S. Bureau of Labor Statistics, Consumer Price Index for All Urban Consumers: All Items in U.S. City Average [CPIAUCSL], retrieved from FRED, Federal Reserve Bank of St. Louis; https://fred.stlouisfed.org/series/CPIAUCSL, May 14, 2024.
Source: U.S. Bureau of Labor Statistics
Release: Employment Situation
Units:
Frequency:
All Employees: Total Nonfarm, commonly known as Total Nonfarm Payroll, is a measure of the number of U.S. workers in the economy that excludes proprietors, private household employees, unpaid volunteers, farm employees, and the unincorporated self-employed. This measure accounts for approximately 80 percent of the workers who contribute to Gross Domestic Product (GDP).
This measure provides useful insights into the current economic situation because it can represent the number of jobs added or lost in an economy. Increases in employment might indicate that businesses are hiring which might also suggest that businesses are growing. Additionally, those who are newly employed have increased their personal incomes, which means (all else constant) their disposable incomes have also increased, thus fostering further economic expansion.
Generally, the U.S. labor force and levels of employment and unemployment are subject to fluctuations due to seasonal changes in weather, major holidays, and the opening and closing of schools. The Bureau of Labor Statistics (BLS) adjusts the data to offset the seasonal effects to show non-seasonal changes: for example, women's participation in the labor force; or a general decline in the number of employees, a possible indication of a downturn in the economy. To closely examine seasonal and non-seasonal changes, the BLS releases two monthly statistical measures: the seasonally adjusted All Employees: Total Nonfarm (PAYEMS) and All Employees: Total Nonfarm (PAYNSA), which is not seasonally adjusted.
The series comes from the 'Current Employment Statistics (Establishment Survey).'
The source code is: CES0000000001
U.S. Bureau of Labor Statistics, All Employees, Total Nonfarm [PAYEMS], retrieved from FRED, Federal Reserve Bank of St. Louis; https://fred.stlouisfed.org/series/PAYEMS, May 14, 2024.
Consumer Price Index for All Urban Consumers: All Items in U.S. City Average
Monthly, Not Seasonally Adjusted Semiannual, Not Seasonally AdjustedAll Employees, Total Nonfarm
Monthly, Not Seasonally Adjusted