Federal Reserve Economic Data: Your trusted data source since 1991
Data in this graph are copyrighted. Please review the copyright information in the series notes before sharing.
NOTES
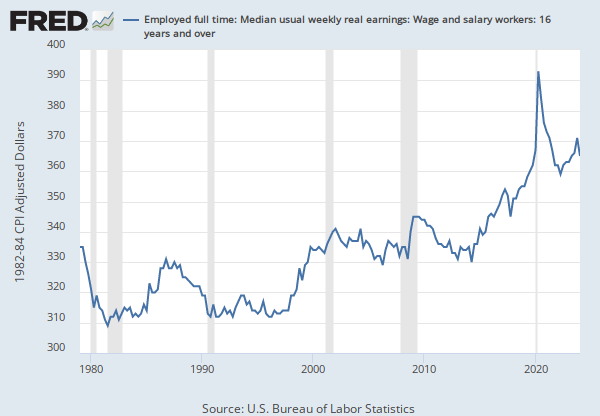
Source: U.S. Bureau of Labor Statistics
Release: Weekly and Hourly Earnings from the Current Population Survey
Units: 1982-84 CPI Adjusted Dollars, Seasonally Adjusted
Frequency: Quarterly
Notes:
Data measure usual weekly earnings of wage and salary workers. Wage and salary workers are workers who receive wages, salaries, commissions, tips, payment in kind, or piece rates. The group includes employees in both the private and public sectors but, for the purposes of the earnings series, it excludes all self-employed persons, both those with incorporated businesses and those with unincorporated businesses.
Usual weekly earnings represent earnings before taxes and other deductions and include any overtime pay, commissions, or tips usually received (at the main job in the case of multiple jobholders). Prior to 1994, respondents were asked how much they usually earned per week. Since January 1994, respondents have been asked to identify the easiest way for them to report earnings (hourly, weekly, biweekly, twice monthly, monthly, annually, or other) and how much they usually earn in the reported time period. Earnings reported on a basis other than weekly are converted to a weekly equivalent. The term "usual" is determined by each respondent's own understanding of the term. If the respondent asks for a definition of "usual," interviewers are instructed to define the term as more than half the weeks worked during the past 4 or 5 months. Visit the BLS for more information.
The series comes from the 'Current Population Survey (Household Survey)'
The source code is: LES1252881600
Suggested Citation:
U.S. Bureau of Labor Statistics, Employed full time: Median usual weekly real earnings: Wage and salary workers: 16 years and over [LES1252881600Q], retrieved from FRED, Federal Reserve Bank of St. Louis; https://fred.stlouisfed.org/series/LES1252881600Q, May 16, 2024.
Source: U.S. Bureau of Labor Statistics
Release: Employment Situation
Units: Percent, Seasonally Adjusted
Frequency: Monthly
Notes:
The series comes from the 'Current Population Survey (Household Survey)'
The source code is: LNS11300000
The Labor Force Participation Rate is defined by the Current Population Survey (CPS) as “the number of people in the labor force as a percentage of the civilian noninstitutional population […] the participation rate is the percentage of the population that is either working or actively looking for work.”
The Labor Force Participation Rate is collected in the CPS and published by the BLS. It is provided on a monthly basis, so this data is used in part by macroeconomists as an initial economic indicator of current labor market trends. The labor force participation rate helps government agencies, financial markets, and researchers gauge the overall health of the economy.
Note that long-run changes in labor force participation may reflect secular economic trends that are unrelated to the overall health of the economy. For instance, demographic changes such as the aging of population can lead to a secular increase of exits from the labor force, shrinking the labor force and decreasing the labor force participation rate.
For more information, see:
U.S. Bureau of Labor Statistics, CES Overview
U.S. Bureau of Labor Statistics, Concepts and Definitions (CPS)
Suggested Citation:
U.S. Bureau of Labor Statistics, Labor Force Participation Rate [CIVPART], retrieved from FRED, Federal Reserve Bank of St. Louis; https://fred.stlouisfed.org/series/CIVPART, May 16, 2024.
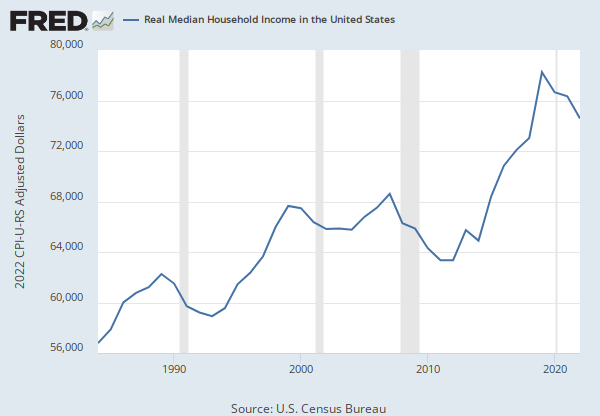
Source: U.S. Census Bureau
Release: Income and Poverty in the United States
Units: 2022 CPI-U-RS Adjusted Dollars, Not Seasonally Adjusted
Frequency: Annual
Notes:
Household data are collected as of March.
As stated in the Census's Source and Accuracy of Estimates for Income, Poverty, and Health Insurance Coverage in the United States: 2011.
Estimation of Median Incomes. The Census Bureau has changed the methodology for computing median income over time. The Census Bureau has computed medians using either Pareto interpolation or linear interpolation. Currently, we are using linear interpolation to estimate all medians. Pareto interpolation assumes a decreasing density of population within an income interval, whereas linear interpolation assumes a constant density of population within an income interval. The Census Bureau calculated estimates of median income and associated standard errors for 1979 through 1987 using Pareto interpolation if the estimate was larger than $20,000 for people or $40,000 for families and households. This is because the width of the income interval containing the estimate is greater than $2,500.
We calculated estimates of median income and associated standard errors for 1976, 1977, and 1978 using Pareto interpolation if the estimate was larger than $12,000 for people or $18,000 for families and households. This is because the width of the income interval containing the estimate is greater than $1,000. All other estimates of median income and associated standard errors for 1976 through 2011 (2012 ASEC) and almost all of the estimates of median income and associated standard errors for 1975 and earlier were calculated using linear interpolation.
Thus, use caution when comparing median incomes above $12,000 for people or $18,000 for families and households for different years. Median incomes below those levels are more comparable from year to year since they have always been calculated using linear interpolation. For an indication of the comparability of medians calculated using Pareto interpolation with medians calculated using linear interpolation, see Series P-60, Number 114, Money Income in 1976 of Families and Persons in the United States.
Suggested Citation:
U.S. Census Bureau, Real Median Household Income in the United States [MEHOINUSA672N], retrieved from FRED, Federal Reserve Bank of St. Louis; https://fred.stlouisfed.org/series/MEHOINUSA672N, May 16, 2024.
RELEASE TABLES
RELATED DATA AND CONTENT
Data Suggestions Based On Your Search
Content Suggestions
Other Formats
Employed full time: Median usual weekly real earnings: Wage and salary workers: 16 years and over
Annual, Not Seasonally Adjusted Quarterly, Not Seasonally AdjustedLabor Force Participation Rate
Monthly, Not Seasonally Adjusted


