Federal Reserve Economic Data: Your trusted data source since 1991
Data in this graph are copyrighted. Please review the copyright information in the series notes before sharing.
NOTES
Source: Board of Governors of the Federal Reserve System (US)
Release: H.15 Selected Interest Rates
Units: Percent, Not Seasonally Adjusted
Frequency: Monthly
Notes:
Averages of daily figures.
For additional historical federal funds rate data, please see Daily Federal Funds Rate from 1928-1954.
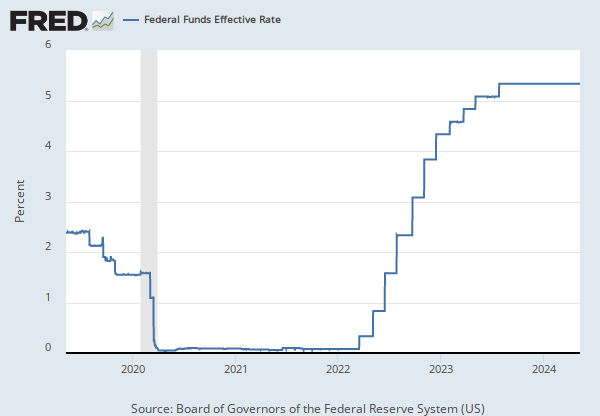
The federal funds rate is the interest rate at which depository institutions trade federal funds (balances held at Federal Reserve Banks) with each other overnight. When a depository institution has surplus balances in its reserve account, it lends to other banks in need of larger balances. In simpler terms, a bank with excess cash, which is often referred to as liquidity, will lend to another bank that needs to quickly raise liquidity. (1) The rate that the borrowing institution pays to the lending institution is determined between the two banks; the weighted average rate for all of these types of negotiations is called the effective federal funds rate.(2) The effective federal funds rate is essentially determined by the market but is influenced by the Federal Reserve through open market operations to reach the federal funds rate target.(2)
The Federal Open Market Committee (FOMC) meets eight times a year to determine the federal funds target rate. As previously stated, this rate influences the effective federal funds rate through open market operations or by buying and selling of government bonds (government debt).(2) More specifically, the Federal Reserve decreases liquidity by selling government bonds, thereby raising the federal funds rate because banks have less liquidity to trade with other banks. Similarly, the Federal Reserve can increase liquidity by buying government bonds, decreasing the federal funds rate because banks have excess liquidity for trade. Whether the Federal Reserve wants to buy or sell bonds depends on the state of the economy. If the FOMC believes the economy is growing too fast and inflation pressures are inconsistent with the dual mandate of the Federal Reserve, the Committee may set a higher federal funds rate target to temper economic activity. In the opposing scenario, the FOMC may set a lower federal funds rate target to spur greater economic activity. Therefore, the FOMC must observe the current state of the economy to determine the best course of monetary policy that will maximize economic growth while adhering to the dual mandate set forth by Congress. In making its monetary policy decisions, the FOMC considers a wealth of economic data, such as: trends in prices and wages, employment, consumer spending and income, business investments, and foreign exchange markets.
The federal funds rate is the central interest rate in the U.S. financial market. It influences other interest rates such as the prime rate, which is the rate banks charge their customers with higher credit ratings. Additionally, the federal funds rate indirectly influences longer- term interest rates such as mortgages, loans, and savings, all of which are very important to consumer wealth and confidence.(2)
References
(1) Federal Reserve Bank of New York. "Federal funds." Fedpoints, August 2007.
(2) Board of Governors of the Federal Reserve System. "Monetary Policy".
Suggested Citation:
Board of Governors of the Federal Reserve System (US), Federal Funds Effective Rate [FEDFUNDS], retrieved from FRED, Federal Reserve Bank of St. Louis; https://fred.stlouisfed.org/series/FEDFUNDS, May 29, 2024.
Source: U.S. Bureau of Economic Analysis
Release: Personal Income and Outlays
Units: Percent, Seasonally Adjusted Annual Rate
Frequency: Monthly
Notes:
BEA Account Code: A072RC
Personal saving as a percentage of disposable personal income (DPI), frequently referred to as "the personal saving rate," is calculated as the ratio of personal saving to DPI.
Personal saving is equal to personal income less personal outlays and personal taxes; it may generally be viewed as the portion of personal income that is used either to provide funds to capital markets or to invest in real assets such as residences.(https://www.bea.gov/national/pdf/all-chapters.pdf)
A Guide to the National Income and Product Accounts of the United States (NIPA).
Suggested Citation:
U.S. Bureau of Economic Analysis, Personal Saving Rate [PSAVERT], retrieved from FRED, Federal Reserve Bank of St. Louis; https://fred.stlouisfed.org/series/PSAVERT, May 29, 2024.
Source: U.S. Bureau of Labor Statistics
Release: Employment Situation
Units: Percent, Seasonally Adjusted
Frequency: Monthly
Notes:
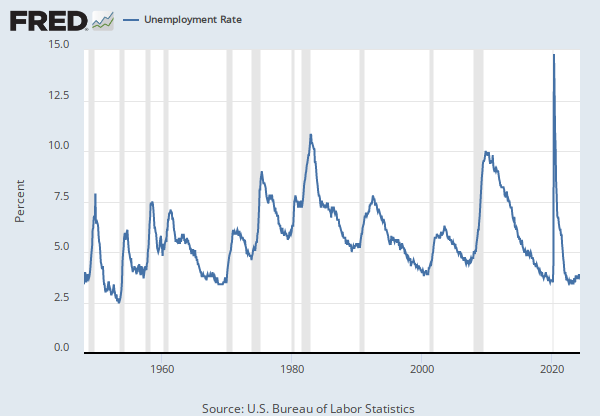
The unemployment rate represents the number of unemployed as a percentage of the labor force. Labor force data are restricted to people 16 years of age and older, who currently reside in 1 of the 50 states or the District of Columbia, who do not reside in institutions (e.g., penal and mental facilities, homes for the aged), and who are not on active duty in the Armed Forces.
This rate is also defined as the U-3 measure of labor underutilization.
The series comes from the 'Current Population Survey (Household Survey)'
The source code is: LNS14000000
Suggested Citation:
U.S. Bureau of Labor Statistics, Unemployment Rate [UNRATE], retrieved from FRED, Federal Reserve Bank of St. Louis; https://fred.stlouisfed.org/series/UNRATE, May 29, 2024.
Source: S&P Dow Jones Indices LLC
Release: S&P CoreLogic Case-Shiller Home Price Indices
Units: Index Jan 2000=100, Seasonally Adjusted
Frequency: Monthly
Notes:
For more information regarding the index, please visit Standard & Poor's. There is more information about home price sales pairs in the Methodology section. Copyright, 2016, Standard & Poor's Financial Services LLC. Reprinted with permission.
Suggested Citation:
S&P Dow Jones Indices LLC, S&P CoreLogic Case-Shiller U.S. National Home Price Index [CSUSHPISA], retrieved from FRED, Federal Reserve Bank of St. Louis; https://fred.stlouisfed.org/series/CSUSHPISA, May 29, 2024.
Source: University of Michigan
Release: Surveys of Consumers
Units: Index 1966:Q1=100, Not Seasonally Adjusted
Frequency: Monthly
Notes:
At the request of the source, the data is delayed by 1 month. To obtain historical data prior to January 1978, please see FRED data series UMCSENT1.
This data should be cited as follows: "Surveys of Consumers, University of Michigan, University of Michigan: Consumer Sentiment © [UMCSENT], retrieved from FRED, Federal Reserve Bank of St. Louis, (Accessed on date)"
Copyright, 2016, Surveys of Consumers, University of Michigan. Reprinted with permission.
Suggested Citation:
University of Michigan, University of Michigan: Consumer Sentiment [UMCSENT], retrieved from FRED, Federal Reserve Bank of St. Louis; https://fred.stlouisfed.org/series/UMCSENT, May 29, 2024.
Source: S&P Dow Jones Indices LLC
Release: Dow Jones Averages
Units: Index, Not Seasonally Adjusted
Frequency: Daily, Close
Notes:
The observations for the Dow Jones Industrial Average represent the daily index value at market close. The market typically closes at 4 PM ET, except for holidays when it sometimes closes early.
The Dow Jones Industrial Average provides a view of the US stock market and economy. Originally, the index was made up of 12 stocks, it now contains 30 component companies in various industries. See indexology for more information.
Copyright © 2016, S&P Dow Jones Indices LLC. All rights reserved. Reproduction of Dow Jones Industrial Average in any form is prohibited except with the prior written permission of S&P Dow Jones Indices LLC ("S&P"). S&P does not guarantee the accuracy, adequacy, completeness or availability of any information and is not responsible for any errors or omissions, regardless of the cause or for the results obtained from the use of such information. S&P DISCLAIMS ANY AND ALL EXPRESS OR IMPLIED WARRANTIES, INCLUDING, BUT NOT LIMITED TO, ANY WARRANTIES OF MERCHANTABILITY OR FITNESS FOR A PARTICULAR PURPOSE OR USE. In no event shall S&P be liable for any direct, indirect, special or consequential damages, costs, expenses, legal fees, or losses (including lost income or lost profit and opportunity costs) in connection with subscriber's or others' use of Dow Jones Industrial Average.
Permission to reproduce this series can be requested from index_services@spdji.com. More contact details are available here, including phone numbers for all regional offices.
Suggested Citation:
S&P Dow Jones Indices LLC, Dow Jones Industrial Average [DJIA], retrieved from FRED, Federal Reserve Bank of St. Louis; https://fred.stlouisfed.org/series/DJIA, May 29, 2024.
RELEASE TABLES
- Monthly, Seasonally Adjusted (population data is not adjusted for seasonal variation; not seasonally adjusted version used)
- Table A-10. Selected unemployment indicators, Seasonally adjusted: Monthly, Unemployment Rates
- Table A-15. Alternative measures of labor underutilization: Monthly, Seasonally Adjusted
RELATED DATA AND CONTENT
Data Suggestions Based On Your Search
Content Suggestions
Other Formats
Federal Funds Effective Rate
Annual, Not Seasonally Adjusted Biweekly, Not Seasonally Adjusted Daily, Not Seasonally Adjusted Daily, Not Seasonally Adjusted Weekly, Not Seasonally AdjustedUnemployment Rate
Monthly, Not Seasonally AdjustedS&P CoreLogic Case-Shiller U.S. National Home Price Index
Monthly, Not Seasonally Adjusted


