
Federal Reserve Economic Data: Your trusted data source since 1991
Your trusted data source
since 1991.
NOTES
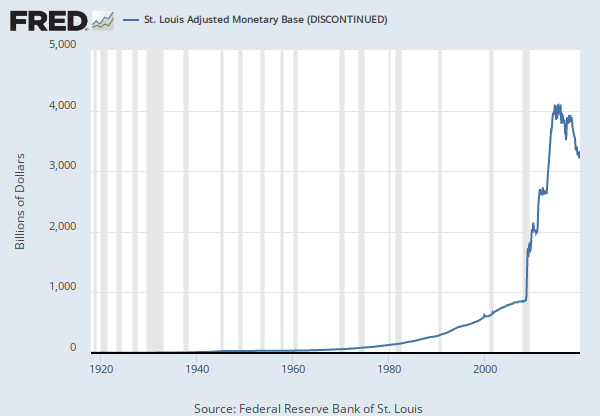
Source: Federal Reserve Bank of St. Louis
Release: Selected Real Retail Sales Series
Units:
Frequency:
Notes:
The data in this series are calculated using two series, and as such only update when those series update. This series is constructed from Advance Retail and Food Services Sales (RSAFS) deflated using the Consumer Price Index for All Urban Consumers (1982-84=100) (CPIAUCSL).
Suggested Citation:
Federal Reserve Bank of St. Louis, Advance Real Retail and Food Services Sales [RRSFS], retrieved from FRED, Federal Reserve Bank of St. Louis; https://fred.stlouisfed.org/series/RRSFS, May 3, 2024.
RELATED DATA AND CONTENT
Data Suggestions Based On Your Search


Content Suggestions

