Federal Reserve Economic Data: Your trusted data source since 1991
Your trusted data source
since 1991.
NOTES
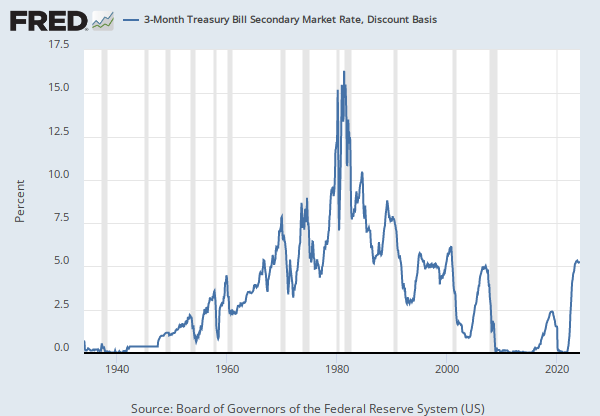
Source: Board of Governors of the Federal Reserve System (US)
Release: H.15 Selected Interest Rates
Units:
Frequency:
Notes:
Discount Basis
Suggested Citation:
Board of Governors of the Federal Reserve System (US), 3-Month Treasury Bill Secondary Market Rate, Discount Basis [DTB3], retrieved from FRED, Federal Reserve Bank of St. Louis; https://fred.stlouisfed.org/series/DTB3, May 13, 2024.
RELEASE TABLES
H.15 Selected Interest Rates
RELATED DATA AND CONTENT
Data Suggestions Based On Your Search


Content Suggestions