FRED Graph
Notes
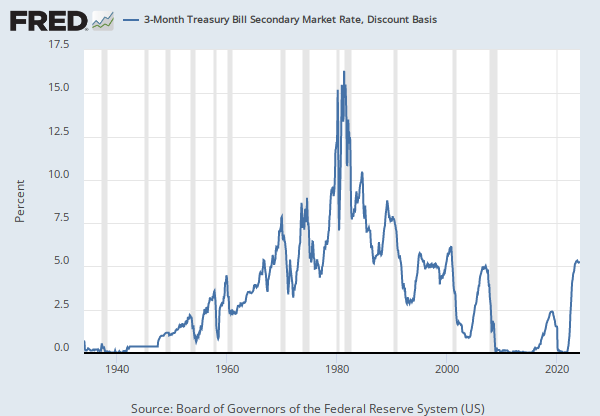
Source: Board of Governors of the Federal Reserve System (US)
Release: H.15 Selected Interest Rates
Units:
Frequency:
Notes:
Averages of business days. For further information regarding treasury constant maturity data, please refer to the H.15 Statistical Release notes and the Treasury Yield Curve Methodology.
For questions on the data, please contact the data source. For questions on FRED functionality, please contact us here.
Suggested Citation:
Board of Governors of the Federal Reserve System (US), Market Yield on U.S. Treasury Securities at 10-Year Constant Maturity, Quoted on an Investment Basis [GS10], retrieved from FRED, Federal Reserve Bank of St. Louis; https://fred.stlouisfed.org/series/GS10, March 30, 2025.
Source: U.S. Census Bureau
Release: National Population Estimates
Units:
Frequency:
Notes:
The intercensal estimates for 1990-2000 for the United States population are produced by converting the 1990-2000 postcensal estimates prepared previously for the U. S. to account for differences between the postcensal estimates in 2000 and census counts (error of closure). The postcensal estimates for 1990 to 2000 were produced by updating the resident population enumerated in the 1990 census by estimates of the components of population change between April 1, 1990 and April 1, 2000-- births to U.S. resident women, deaths to U.S. residents, net international migration (incl legal & residual foreign born), and net movement of the U.S. armed forces and civilian citizens to the United States. Intercensal population estimates for 1990 to 2000 are derived from the postcensal estimates by distributing the error of closure over the decade by month. The method used for the 1990s for distributing the error of closure is the same that was used for the 1980s. This method produces an intercensal estimate as a function of time and the postcensal estimates,using the following formula: the population at time t is equal to the postcensal estimate at time t multiplied by a function. The function is the April 1, 2000 census count divided by the April 1, 2000 postcensal estimate raised to the power of t divided by 3653.
Suggested Citation:
U.S. Census Bureau, Total Population: All Ages including Armed Forces Overseas [POP], retrieved from FRED, Federal Reserve Bank of St. Louis; https://fred.stlouisfed.org/series/POP, March 30, 2025.
Source: Board of Governors of the Federal Reserve System (US)
Release: H.15 Selected Interest Rates
Units:
Frequency:
Notes:
For further information regarding treasury constant maturity data, please refer to the H.15 Statistical Release notes and the Treasury Yield Curve Methodology.
For questions on the data, please contact the data source. For questions on FRED functionality, please contact us here.
Suggested Citation:
Board of Governors of the Federal Reserve System (US), Market Yield on U.S. Treasury Securities at 10-Year Constant Maturity, Quoted on an Investment Basis, Inflation-Indexed [DFII10], retrieved from FRED, Federal Reserve Bank of St. Louis; https://fred.stlouisfed.org/series/DFII10, March 30, 2025.
Source: Board of Governors of the Federal Reserve System (US)
Release: H.6 Money Stock Measures
Units:
Frequency:
Notes:
Before May 2020, M2 consists of M1 plus (1) savings deposits (including money market deposit accounts); (2) small-denomination time deposits (time deposits in amounts of less than $100,000) less individual retirement account (IRA) and Keogh balances at depository institutions; and (3) balances in retail money market funds (MMFs) less IRA and Keogh balances at MMFs.
Beginning May 2020, M2 consists of M1 plus (1) small-denomination time deposits (time deposits in amounts of less than $100,000) less IRA and Keogh balances at depository institutions; and (2) balances in retail MMFs less IRA and Keogh balances at MMFs. Seasonally adjusted M2 is constructed by summing savings deposits (before May 2020), small-denomination time deposits, and retail MMFs, each seasonally adjusted separately, and adding this result to seasonally adjusted M1.
For more information on the H.6 release changes and the regulatory amendment that led to the creation of the other liquid deposits component and its inclusion in the M1 monetary aggregate, see the H.6 announcements and Technical Q&As posted on December 17, 2020.
For questions on the data, please contact the data source. For questions on FRED functionality, please contact us here.
Suggested Citation:
Board of Governors of the Federal Reserve System (US), M2 [M2SL], retrieved from FRED, Federal Reserve Bank of St. Louis; https://fred.stlouisfed.org/series/M2SL, March 30, 2025.
Source: Board of Governors of the Federal Reserve System (US)
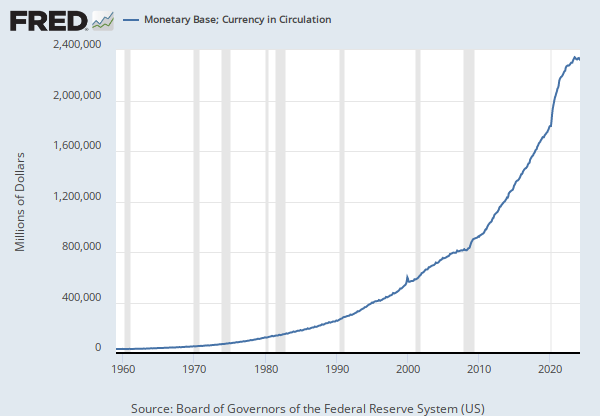
Release: H.3 Aggregate Reserves of Depository Institutions and the Monetary Base
Units:
Frequency:
Notes:
The Board of Governors discontinued the H.3 statistical release on September 17, 2020. For more information, please see the announcement posted on August 20, 2020.
The series equals total balances maintained plus currency in circulation.
Effective February 2, 1984, reserve computation and maintenance periods have been changed from weekly to bi-weekly. Series with data prior to February 2, 1984 have different values reported from one week to the next. After February 2, 1984, the value repeats for 2 consecutive weeks.
Suggested Citation:
Board of Governors of the Federal Reserve System (US), Monetary Base; Total (DISCONTINUED) [BOGMBASEW], retrieved from FRED, Federal Reserve Bank of St. Louis; https://fred.stlouisfed.org/series/BOGMBASEW, March 30, 2025.
Source: U.S. Bureau of Economic Analysis
Release: Gross Domestic Product
Units:
Frequency:
Notes:
BEA Account Code: A191RX
Real gross domestic product is the inflation adjusted value of the goods and services produced by labor and property located in the United States.For more information see the Guide to the National Income and Product Accounts of the United States (NIPA). For more information, please visit the Bureau of Economic Analysis.
Suggested Citation:
U.S. Bureau of Economic Analysis, Real Gross Domestic Product [GDPC1], retrieved from FRED, Federal Reserve Bank of St. Louis; https://fred.stlouisfed.org/series/GDPC1, March 30, 2025.
Source: Board of Governors of the Federal Reserve System (US)
Release: H.15 Selected Interest Rates
Units:
Frequency:
Notes:
For further information regarding treasury constant maturity data, please refer to the H.15 Statistical Release notes and Treasury Yield Curve Methodology.
For questions on the data, please contact the data source. For questions on FRED functionality, please contact us here.
Suggested Citation:
Board of Governors of the Federal Reserve System (US), Market Yield on U.S. Treasury Securities at 10-Year Constant Maturity, Quoted on an Investment Basis [DGS10], retrieved from FRED, Federal Reserve Bank of St. Louis; https://fred.stlouisfed.org/series/DGS10, March 30, 2025.
Release Tables
- Table 1.1.6. Real Gross Domestic Product, Chained Dollars: Quarterly
- Table 1.2.6. Real Gross Domestic Product by Major Type of Product, Chained Dollars: Quarterly
- Table 1.3.6. Real Gross Value Added by Sector, Chained Dollars: Quarterly
- Table 1.4.6. Relation of Real Gross Domestic Product, Real Gross Domestic Purchases, and Real Final Sales to Domestic Purchasers, Chained Dollars: Quarterly
- Table 1.5.6. Real Gross Domestic Product, Expanded Detail, Chained Dollars: Quarterly
- Table 1.7.6. Relation of Real Gross Domestic Product, Real Gross National Product, and Real Net National Product, Chained Dollars: Quarterly
- Table 1.8.6. Command-Basis Real Gross Domestic Product and Gross National Product, Chained Dollars: Quarterly
- Table 1.17.6. Real Gross Domestic Product, Real Gross Domestic Income, and Other Major NIPA Aggregates, Chained Dollars: Quarterly
- Selected Interest Rates Instruments, Yields in percent per annum: Daily
- Selected Interest Rates Instruments, Yields in percent per annum: Monthly
Related Data and Content
Data Suggestions Based On Your Search


Content Suggestions


Other Formats
Market Yield on U.S. Treasury Securities at 10-Year Constant Maturity, Quoted on an Investment Basis
Annual, Not Seasonally Adjusted Monthly, Not Seasonally Adjusted Weekly, Not Seasonally AdjustedMarket Yield on U.S. Treasury Securities at 10-Year Constant Maturity, Quoted on an Investment Basis, Inflation-Indexed
Annual, Not Seasonally Adjusted Monthly, Not Seasonally Adjusted Weekly, Not Seasonally AdjustedM2
Monthly, Not Seasonally Adjusted Weekly, Not Seasonally AdjustedReal Gross Domestic Product
Annual, Not Seasonally Adjusted Quarterly, Not Seasonally Adjusted Index 2017=100, Quarterly, Not Seasonally Adjusted Percent Change from Preceding Period, Annual, Not Seasonally Adjusted Percent Change from Preceding Period, Quarterly, Seasonally Adjusted Annual Rate Percent Change from Quarter One Year Ago, Quarterly, Not Seasonally Adjusted Percent Change from Quarter One Year Ago, Quarterly, Seasonally Adjusted